
The EUR/USD currency pair
Technical indicators of the currency pair:
Prev Open: 1.10421
Open: 1.09985
% chg. over the last day: -0.39
Day’s range: 1.09942 – 1.10015
52 wk range: 1.0879 – 1.1572
Greenbeck continued its growth against its main competitors. Yesterday the fall of EUR/USD quotes exceeded 45 points. The trading instrument reached key lows. The American currency was supported by the positive economic releases. According to ADP report, in January the number of employed in the non-agricultural sector of the country grew by 291K versus market expectations at 156K. ISM Non-Farm Supply Managers Index accelerated from 54.9 to 55.5. Currently, EUR/USD quotes are consolidated in the range 1.09900-1.10100. Positions should be opened from key levels.
The Economic News Feed for 06.02.2020:
Initial Jobless Claims (US) – 15:30 (GMT+2:00);
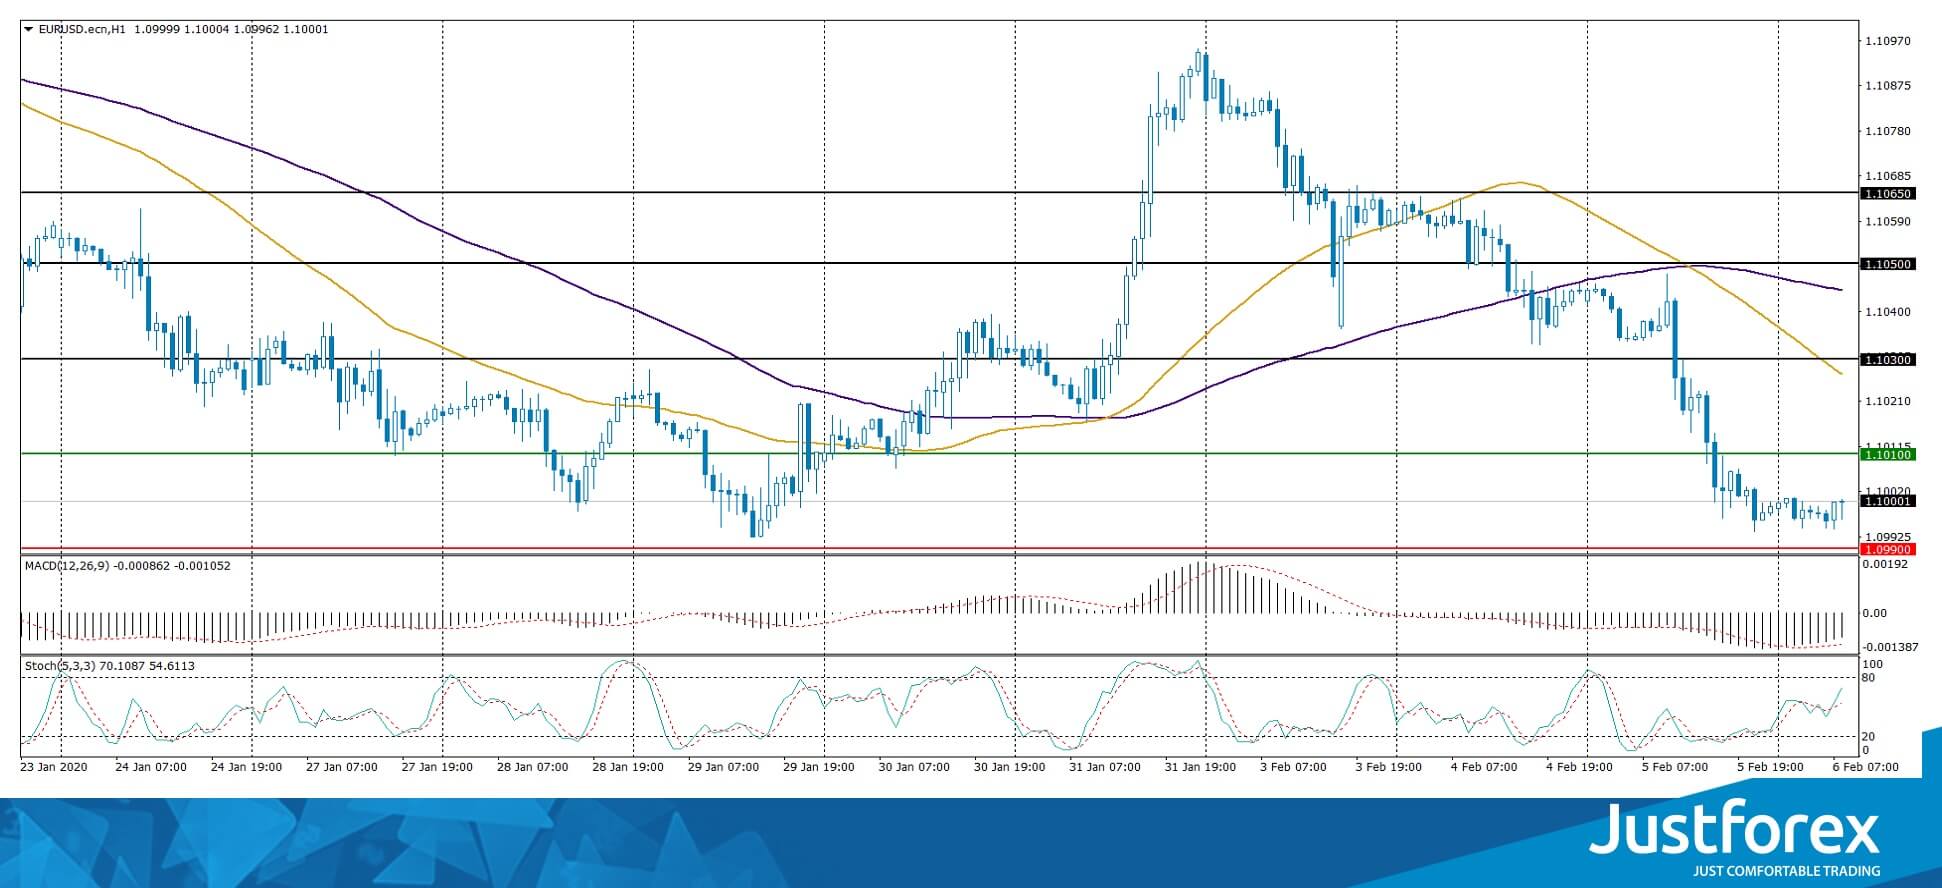
Indicators do not give accurate signals: the price has fixed below 50 MA and 100 MA.
The MACD histogram is in the negative zone, but above the signal line, which gives a weak sell signal for EUR/USD.
The Stochastic Oscillator is in the neutral zone, the %K line is above the %D line, which indicates a bullish mood.
Trading recommendations
Support levels: 1.09900, 1.09500
Resistance levels: 1.10100, 1.10300, 1.10500
If the price fixes below 1.09900, further decline of EUR/USD quotes is expected to 1.09600-1.09400.
Alternatively, the quotes could grow to 1.10300-1.10500.
The GBP/USD currency pair
Technical indicators of the currency pair:
Prev Open: 1.30316
Open: 1.29994
% chg. over the last day: -0.18
Day’s range: 1.29717 – 1.30014
52 wk range: 1.1959 – 1.3516
The technical picture on the GBP/USD currency pair is ambiguous. Sterling is being traded in a flat. There is no defined trend. At the moment the following key support and resistance levels can be identified: 1.29550 and 1.30100, respectively. Demand for the US dollar remains at a high level. GBP/USD quotes can move further down. We recommend opening positions from key levels.
Today the publication of important economic releases from the UK is not planned.
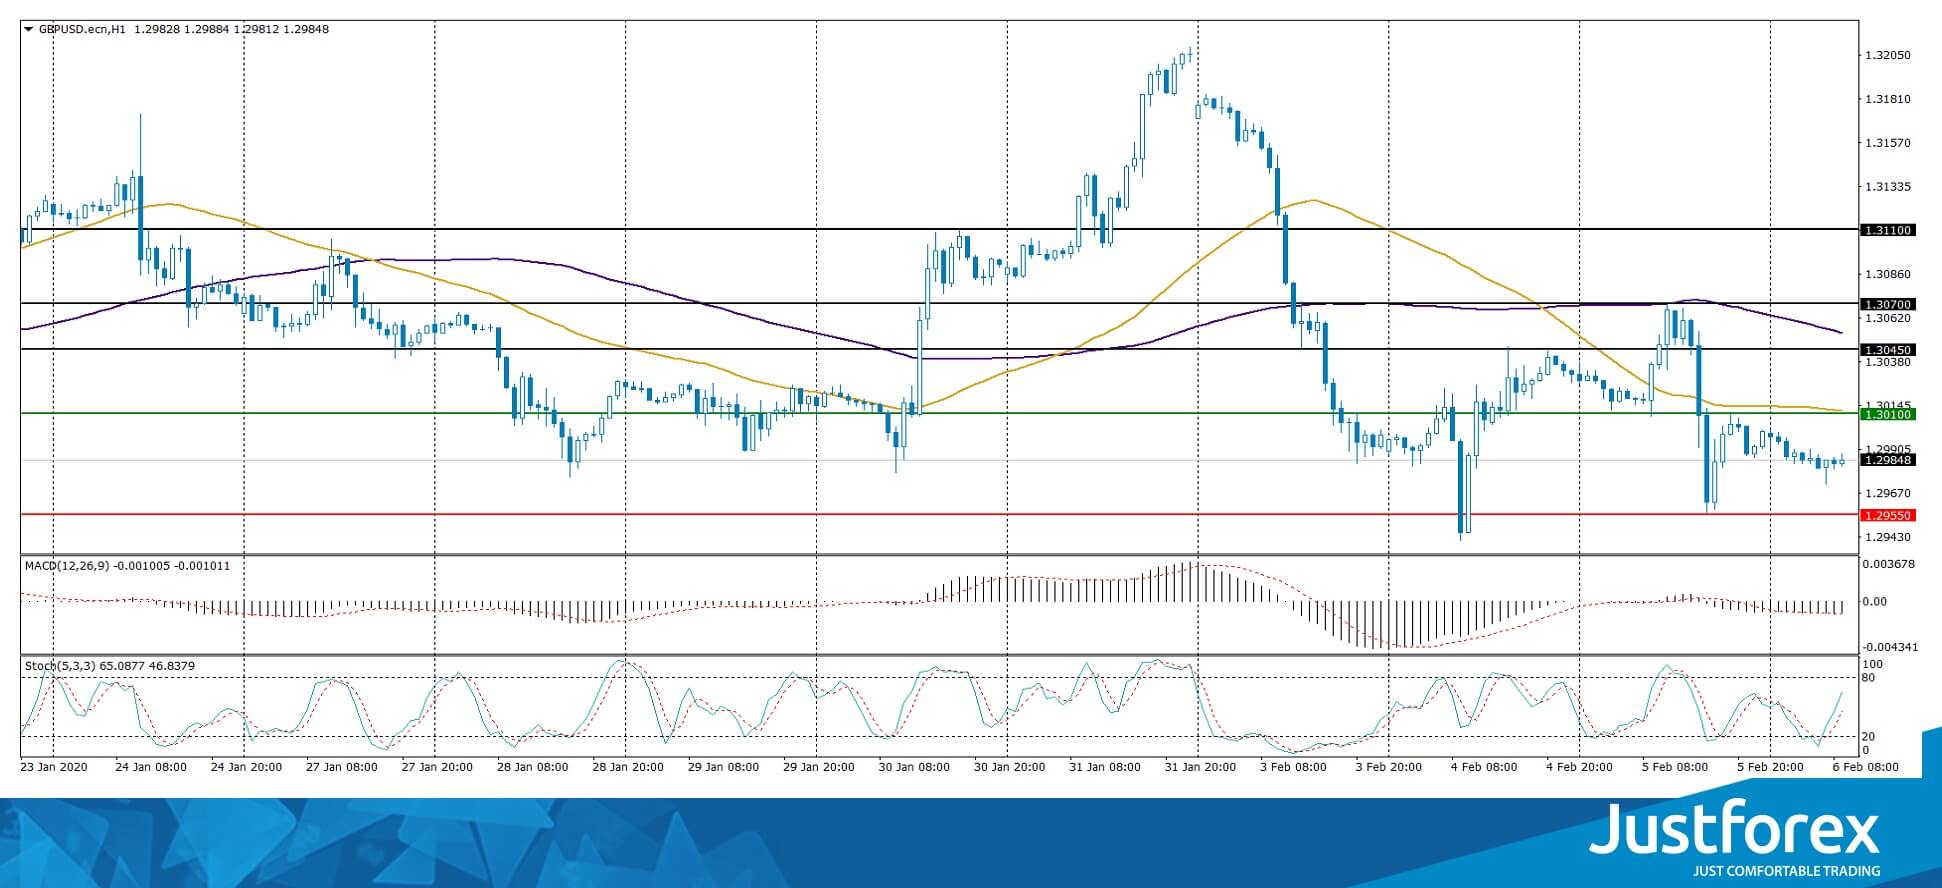
The price is fixed below 50 MA and 100 MA, which signals the strength of the sellers.
The MACD histogram is in the negative zone, which indicates bearish sentiments.
The Stochastic Oscillator is in the neutral zone, the %K line is above the %D line, which gives a signal to buy GBP/USD.
Trading recommendations
Support levels: 1.29550, 1.29000
Resistance levels: 1.30100, 1.30450, 1.30700
If the price fixes below 1.29550, expect quotes to fall toward 1.29000.
Alternativel, the quotes could rise toward 1.30500-1.30800.
The USD/CAD currency pair
Technical indicators of the currency pair:
Prev Open: 1.32765
Open: 1.32821
% chg. over the last day: +0.09
Day’s range: 1.32800 – 1.32886
52 wk range: 1.2949 – 1.3566
USD/CAD quotes continue to consolidate after prolonged growth. There is no defined trend. The CAD is testing local support and resistance levels at 1.32650 and 1.33000, respectively. Technical correction is not ruled out in the nearest future. We recommend you to pay attention to the black gold price dynamics. Positions should be opened from key levels.
The news background on Canadian economy is calm.
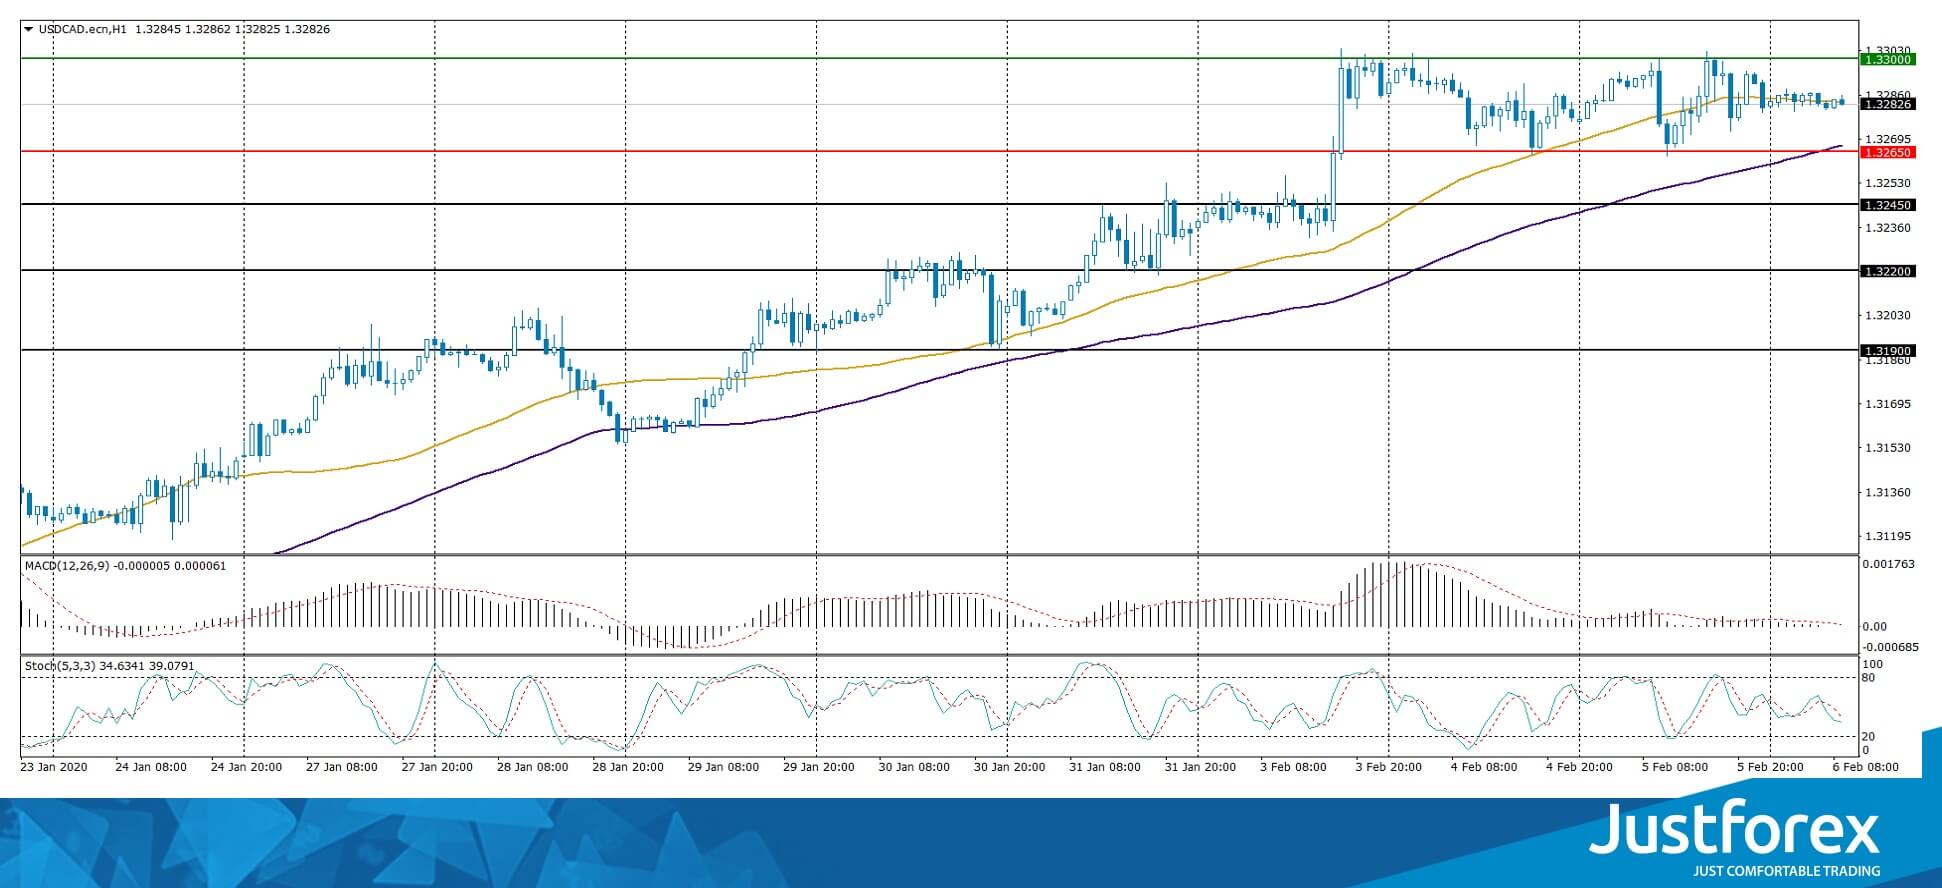
Indicators do not give accurate signals: the price has crossed 50 MA.
MACD histogram is near the 0 mark.
The Stochastic Oscillator is located in the neutral zone, the %K line is below the %D line, which indicates a bearish mood.
Trading recommendations
Support levels: 1.32650, 1.32450, 1.32200
Resistance levels: 1.33000, 1.33400
If the price fixes above 1.33000, further growth of USD/CAD quotes is expected to reach 1.33300-1.33500.
Alternatively, the quotes could descend to 1.32300-1.32100. .
The USD/JPY currency pair
Technical indicators of the currency pair:
Prev Open: 109.515
Open: 109.817
% chg. over the last day: +0.27
Day’s range: 109.697 – 109.981
52 wk range: 104.45 – 113.53
The USD/JPY currency pair continues to show a stable upward trend. The trading instrument reached the key extremums. At the moment, the safe haven currency is consolidating. Local support and resistance levels are acting 109.700 and 110.000, respectively. We do not rule out further growth of USD/JPY quotes. We recommend you to pay attention to the dynamics of the US government securities yield. Positions should be opened from key levels.
The Economic News Feed for 06.02.2020 is calm.
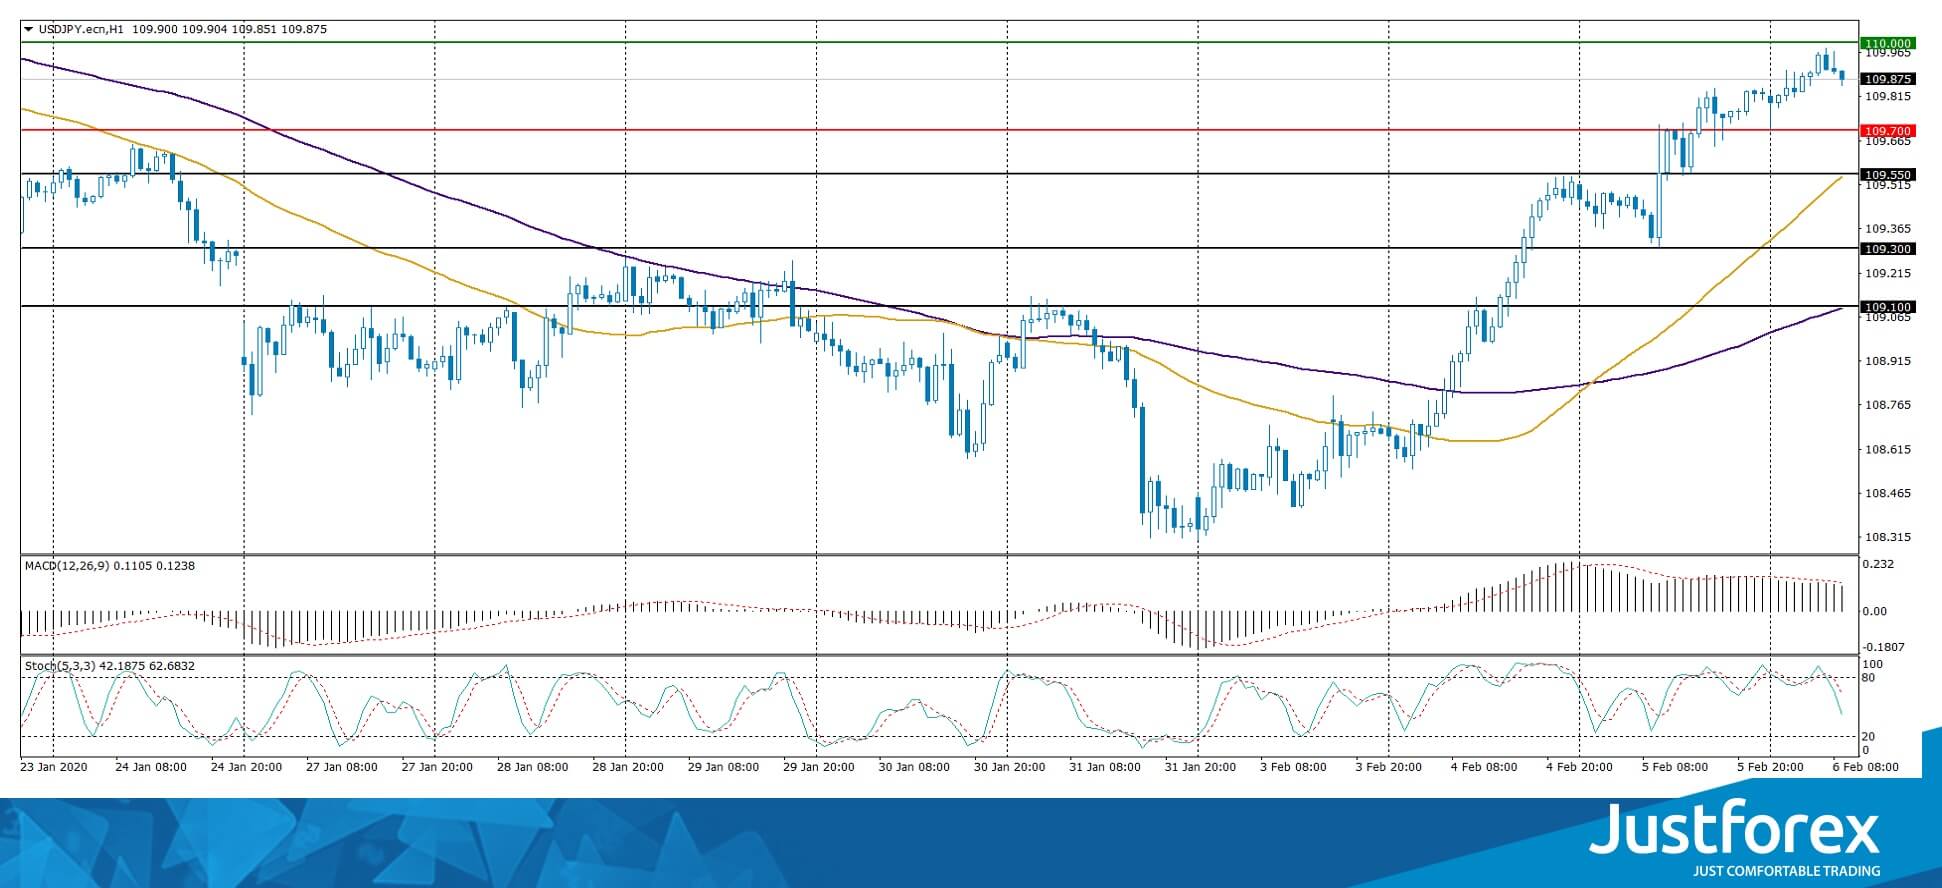
The indicators signal the strength of buyers: the price has fixed above 50 MA and 100 MA.
The MACD histogram is in the positive zone, but below the signal line, which gives a weak signal to buy USD/JPY.
The Stochastic Oscillator is in the neutral zone, the %K line is below the %D line, which indicates a bearish sentiment.
Trading recommendations
Support levels: 109.700, 109.550, 109.300
Resistance levels: 110.00, 110.250
If the price fixes above 110.000, expect the quotes to rise toward 110.250-110.400.
Alternatively, the quotes could descend toward 109.500-109.300.


