
Major US stock indexes, particularly the NASDAQ tumbled sharply overnight, while benchmark treasury yields surged. Investors are still in the process of adjusting to the evolution of a more aggressive Fed in terms of stimulus withdrawal. At the same time, it’s unsure when the no-longer-transitory inflation would start easing down, and Fed’s response to that.
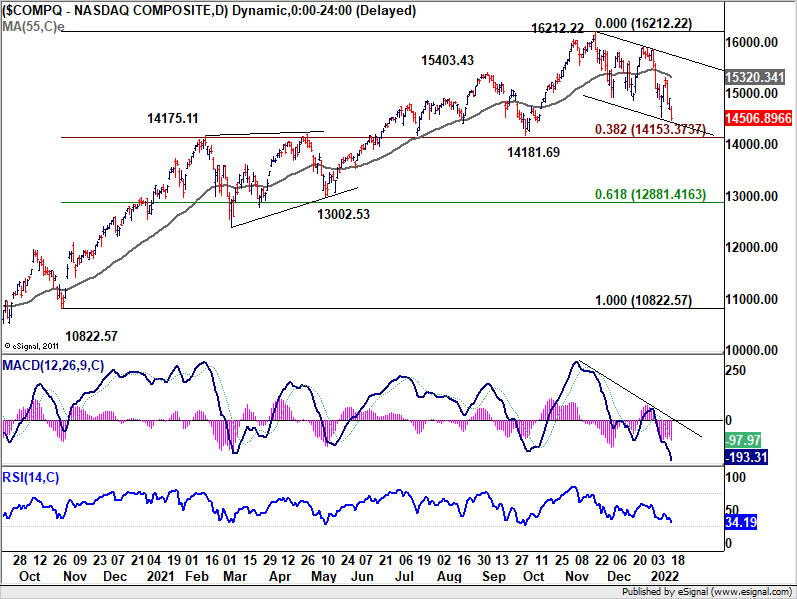
NASDAQ dropped -2.6% to close at 14506.89. The development is not a surprise as price actions from 16212.22 are seen as correcting the up trend from 10822.57 to 16212.22. Deeper fall could be seen. But we’d expect strong support around 14100/14200 to contain downside to bring rebound. The support zone coincides with 14715.11 resistance turned support, 14181.69 structural support, and 38.2% retracement of 10822.57 to 16212.22 at 14153.37. However, sustained break of this level will argue that NASDAQ is already in a larger scale correction.
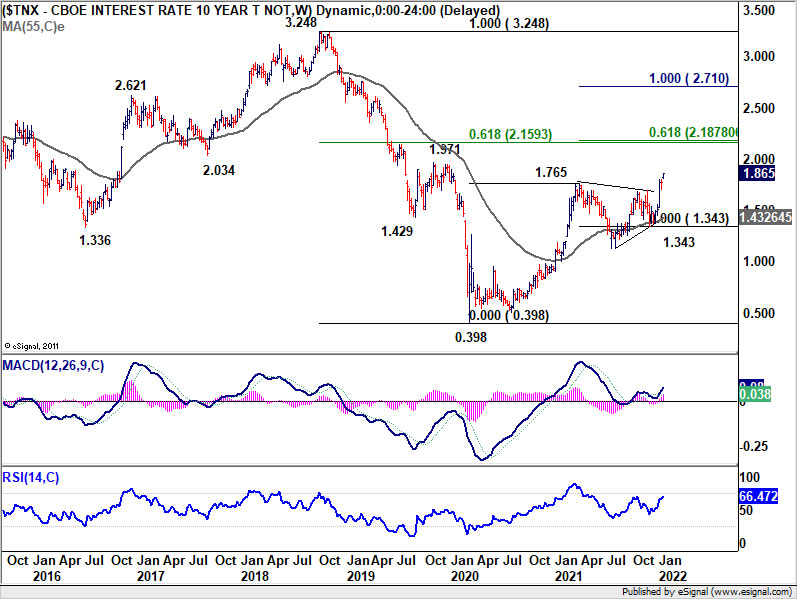
10-year yield rose 0.093 to close at 1.865. The medium term up trend is back in full force. 2% handle now looks rather approachable. But TNX should start to feel heavy above there. There should be strong resistance from 2.16/18 zone to repel the rally. This is a cluster level of 61.8% projection of 0.398 to 1.765 from 1.343 at 2.187 and 61.8% retracement of 3.248 to 0.398 at 2.159. But then, a strong break there would indicate some substantial underlying development is underway.


