
Hello fellow traders. In this technical article we’re going to look at the Elliott Wave charts of AUDJPY forex pair published in members area of the website. The pair has recently given us a 3 waves bounce that completed precisely at the equal legs area as we expected. In the following text, we’ll explain the Elliott Wave analysis and present target areas.
AUDJPY Elliott Wave 1 Hour Chart 05.28.2025
EURUSD is currently forming a three-wave pullback against the95.63 peak, unfolding as a Zig Zag pattern — (a)-(b)-(c). Our members are aware that we get the potential reversal area by measuring the Equal Legs zone, (a)-(b) . This zone comes at 93.65-94.61 area. We expect sellers to emerge within this region and anticipate a continuation of the decline toward new lows ideally.
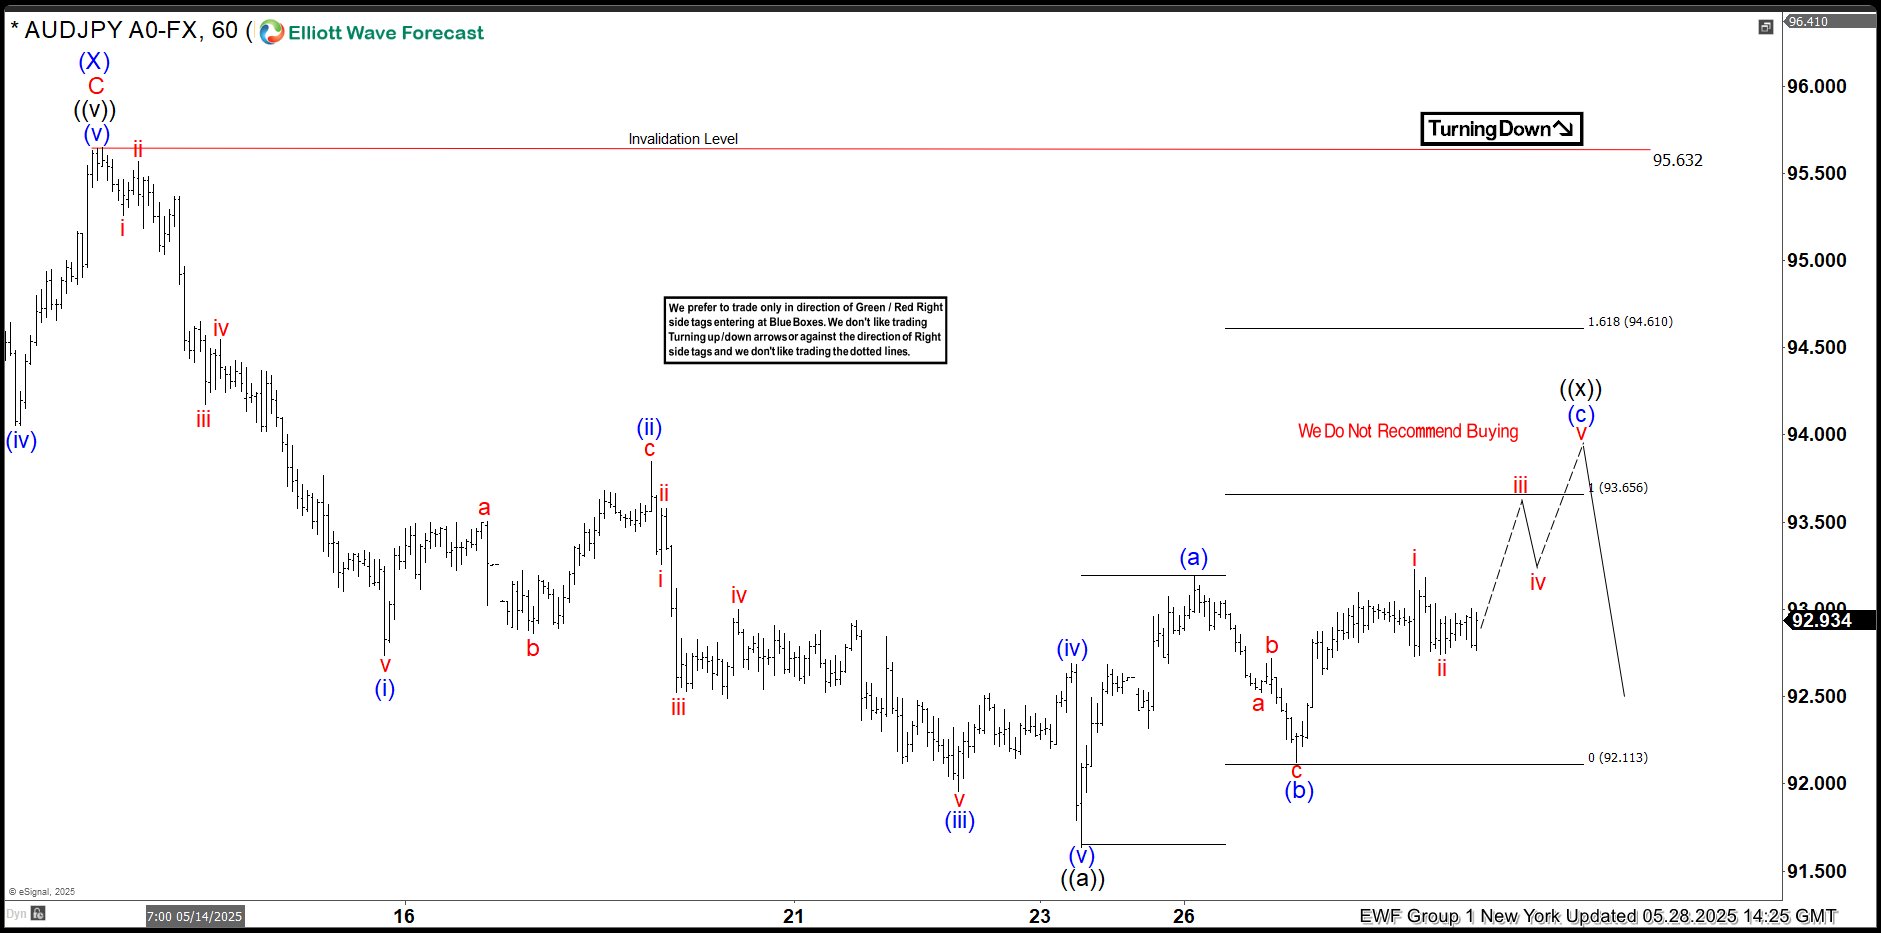
AUDJPY Elliott Wave 1 Hour Chart 05.28.2025
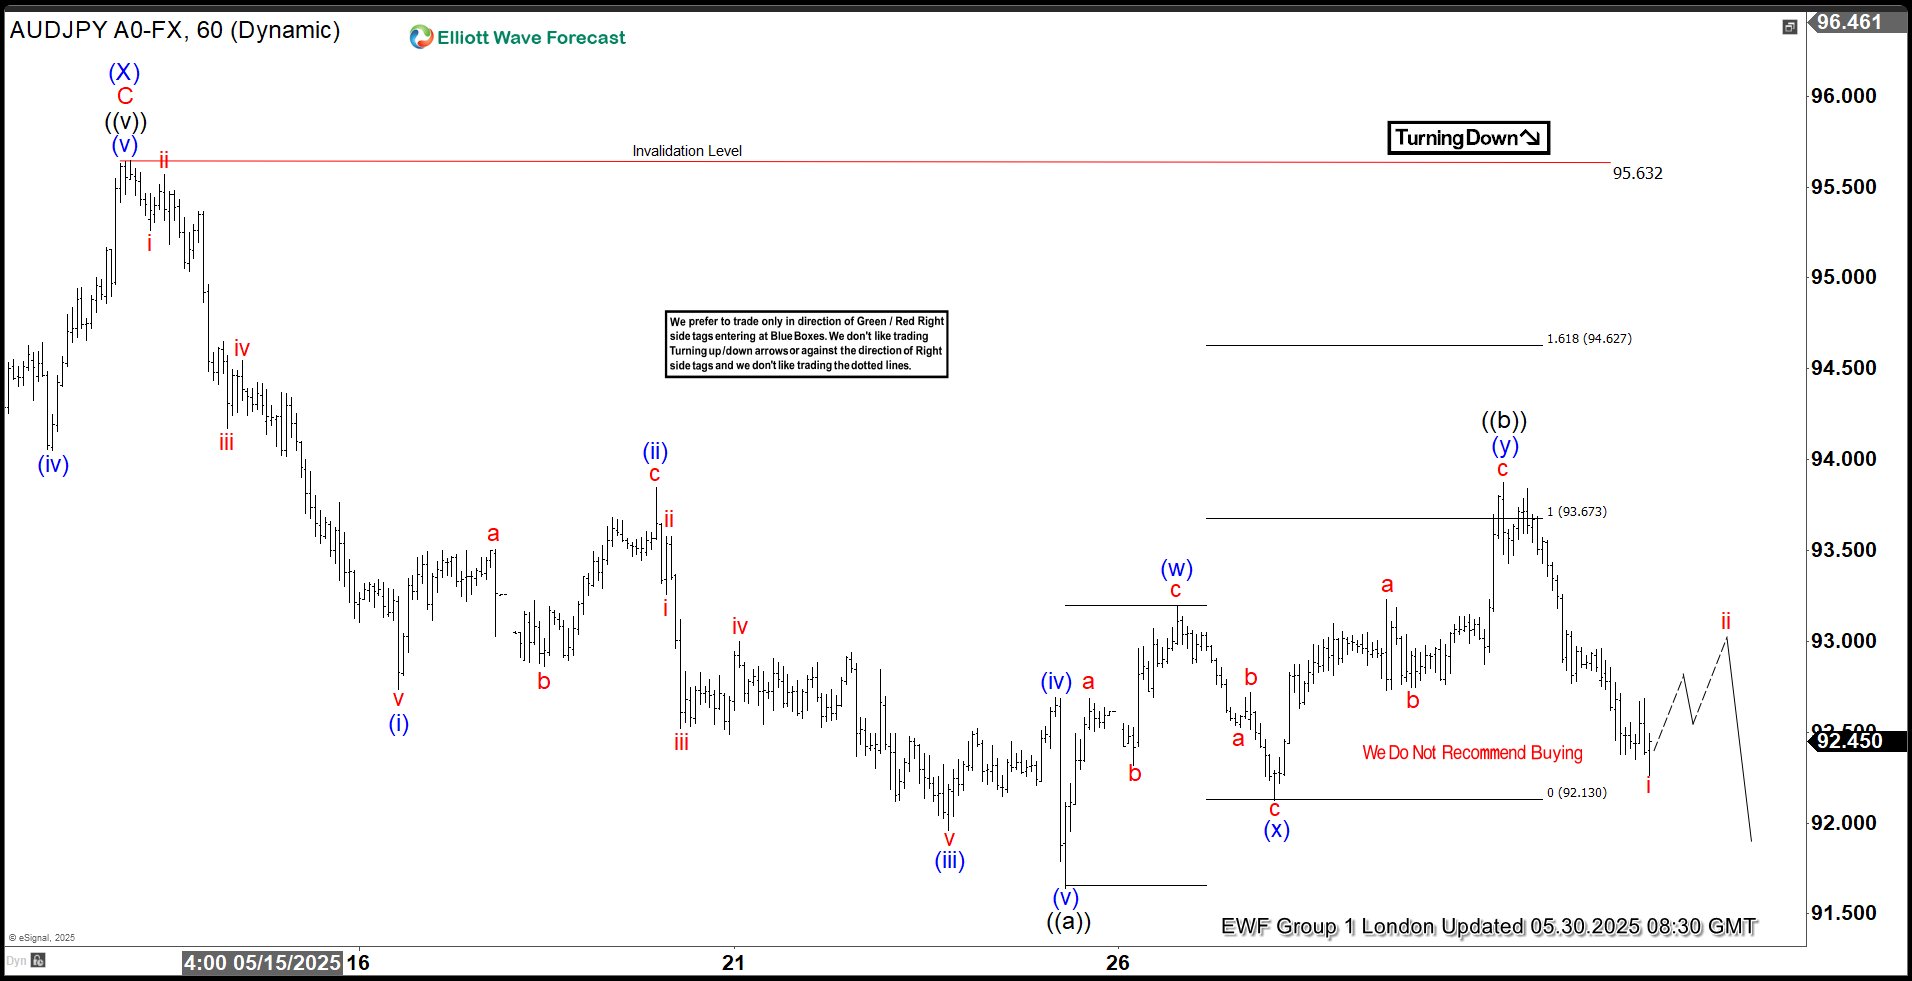
The pair found sellers as expected in the Equal Legs area and has delivered a decent decline so far. We would now like to see a break below the May 23rd low to confirm that the next leg lower is in place. In that case, further downside extension would be expected, ideally targeting the 89.86 area.


