
Key Highlights
- GBP/USD started a strong increase above the 1.3250 resistance.
- A bullish trend line is forming with support at 1.3235 on the 4-hour chart.
- Bitcoin recovered some losses and climbed above $92,000.
- Crude Oil price faced resistance near $60.00.
GBP/USD Technical Analysis
The British Pound formed a base and climbed above 1.3200 against the US Dollar. GBP/USD even cleared the 1.3250 resistance before the bears appeared.
Looking at the 4-hour chart, the pair settled above 1.3250, the 100 simple moving average (red, 4-hour), and the 200 simple moving average (green, 4-hour). The bulls pushed the pair above 1.3300 and there are chances of more upside.
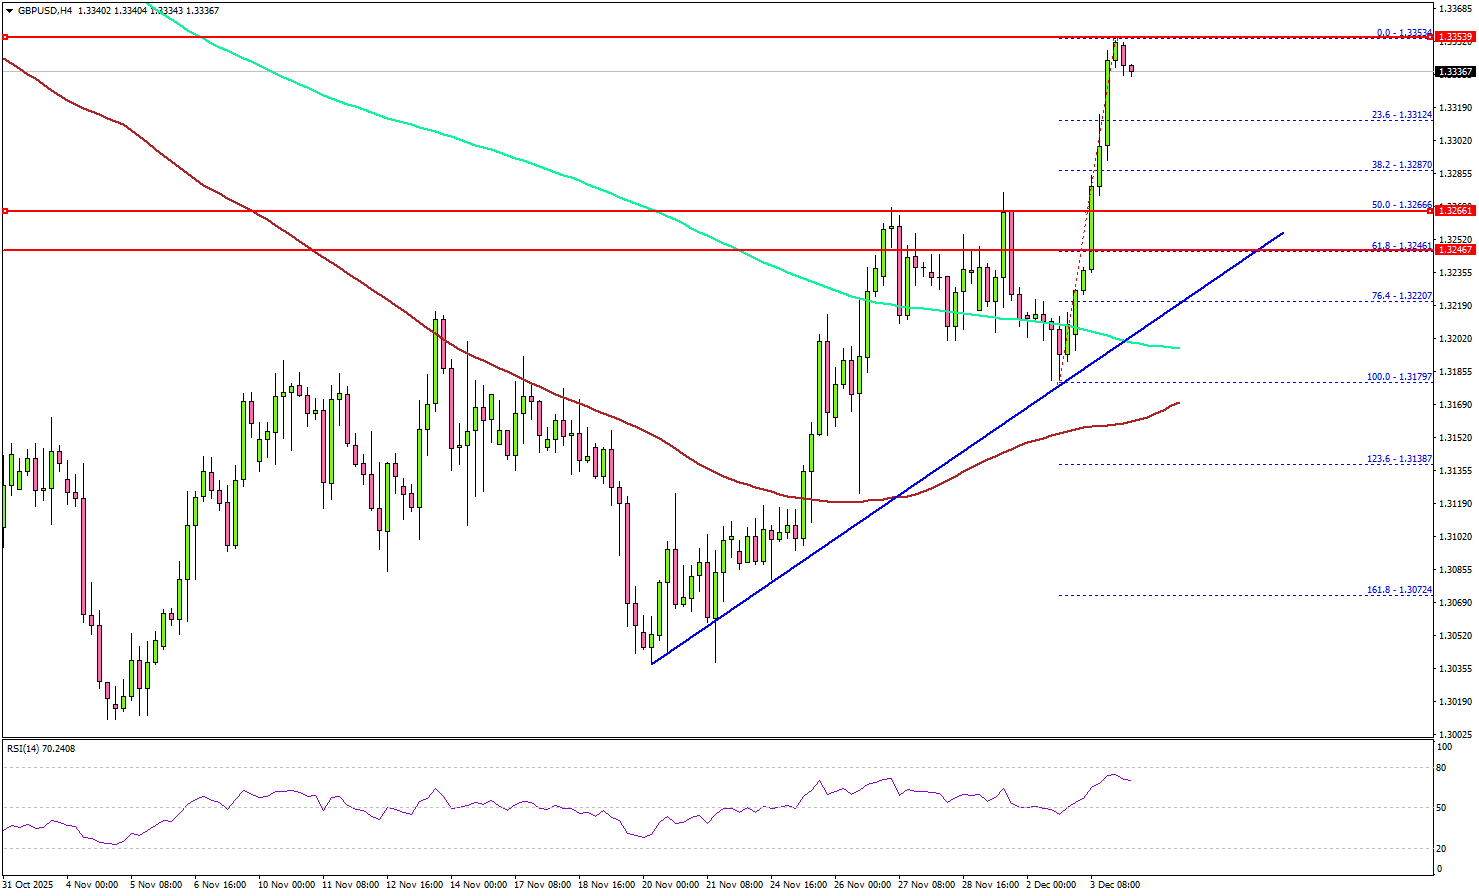
Immediate resistance sits near 1.3350. The first key hurdle is seen near 1.3365. A close above 1.3365 could open the doors for a move toward 1.3400. Any more gains could set the pace for a steady increase toward 1.3500.
On the downside, there is key support at 1.3265. The next support is 1.3240. There is also a bullish trend line forming with support at 1.3235, below which the pair could start a steady decline to 1.3200.
A downside break below 1.3200 could send the pair toward 1.3165 and the 100 simple moving average (red, 4-hour). The main support sits at 1.3050.
Looking at EUR/USD, the pair gained bullish momentum, and the bulls were able to send the pair above the 1.1650 resistance.
Upcoming Key Economic Events:
- UK’s Construction PMI for Nov 2025 – Forecast 44.3, versus 44.1 previous.
- US Initial Jobless Claims – Forecast 220K, versus 216K previous.


