
The Nasdaq 100 index (US Tech 100 mini on FXOpen) showed sharp volatility yesterday following the interest rate announcement. The market action can be interpreted as follows:
→ First, the FOMC decision was released: as expected, the Federal Funds Rate was cut from 4.00% to 3.75% (a bullish catalyst), which pushed the index up towards point A.
→ However, half an hour later Jerome Powell’s press conference began, and his tone was noticeably hawkish (a bearish catalyst). The Fed Chair signalled that the rate-cutting cycle has been paused because inflation remains elevated and additional labour-market data is needed. As a result, the index fell sharply from point A to the low at point B.
Meanwhile, Donald Trump criticised the Fed’s decision, arguing that rates should be cut far more aggressively. This adds to uncertainty, especially given expectations that Powell will leave his post in May 2026.
Bearish pressure on the tech index intensified further after Oracle’s earnings release — see yesterday’s post for details. The results disappointed investors, fuelling renewed talk of an AI bubble, and ORCL shares plunged around 11% in after-hours trading.
Technical Analysis of the Nasdaq 100 Chart
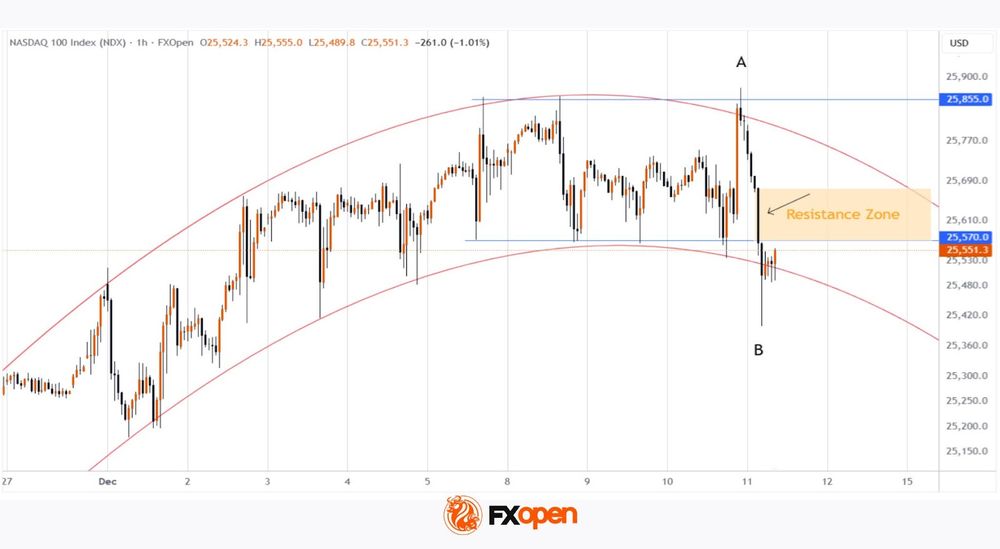
Looking at recent price action in the Nasdaq 100 (US Tech 100 mini on FXOpen), the index appears to be forming a bearish Rounding Top pattern:
→ The peak at point A resembles a bull trap, as the price only slightly exceeded the December highs before reversing — in SMC terms, a sign of a bearish liquidity grab.
→ The price then broke support from several recent sessions around 25,570 after forming a large bearish candle (marked by the arrow). This indicates strong selling pressure (a market imbalance) and the area may now act as resistance.
It is possible that bulls will attempt to recover some of yesterday’s losses today. However, if any rebound stalls near this resistance zone, the Nasdaq 100 (US Tech 100 mini on FXOpen) may continue to drift lower along a rounding downward trajectory.
Trade global index CFDs with zero commission and tight spreads. Open your FXOpen account now or learn more about trading index CFDs with FXOpen.
This article represents the opinion of the Companies operating under the FXOpen brand only. It is not to be construed as an offer, solicitation, or recommendation with respect to products and services provided by the Companies operating under the FXOpen brand, nor is it to be considered financial advice.


 showed sharp volatility yesterday following the interest rate announcement. The market action can be interpreted as follows:)