
AUD/USD started a fresh increase above 0.6700. NZD/USD is also rising and might aim for more gains above 0.5850.
Important Takeaways for AUD/USD and NZD/USD Analysis Today
- The Aussie Dollar started an increase above 0.6650 against the US Dollar.
- There is a short-term bullish trend line forming with support at 0.6695 on the hourly chart of AUD/USD at FXOpen.
- NZD/USD is consolidating gains above the 0.5800 handle.
- There is a key bullish flag pattern forming with resistance at 0.5840 on the hourly chart of NZD/USD at FXOpen.
AUD/USD Technical Analysis
On the hourly chart of AUD/USD at FXOpen, the pair started a fresh increase from 0.6600. The Aussie Dollar was able to clear 0.6650 to move into a positive zone against the US Dollar.
There was a close above 0.6580 and the 50-hour simple moving average. Finally, the pair tested 0.6725. A high was formed near 0.6724 and the pair recently started a short-term downside correction. There was a minor decline below 0.6700.
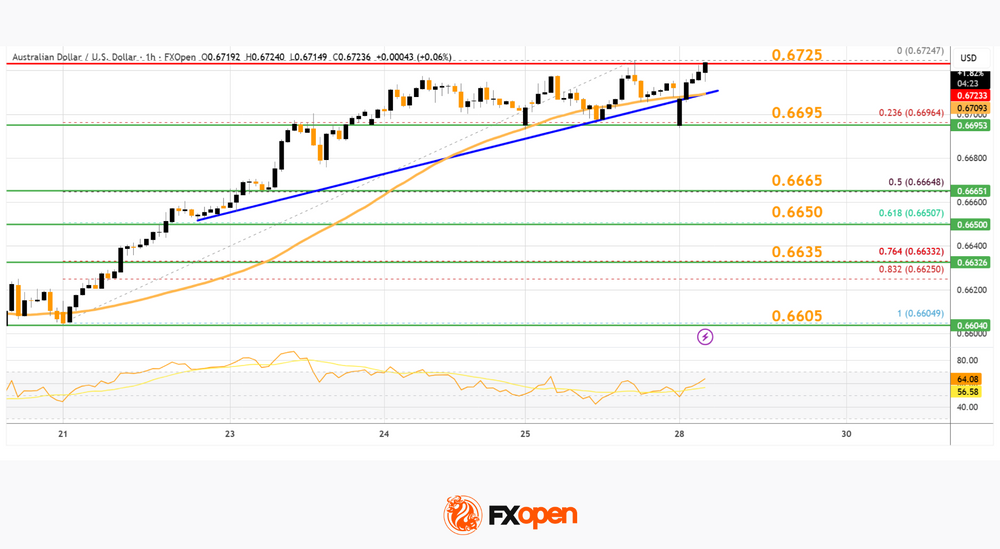
On the downside, initial support is near a short-term bullish trend line at 0.6695 and the 50-hour simple moving average. The next area of interest could be 0.6665 and the 50% Fib retracement level of the upward move from the 0.6604 swing low to the 0.6724 high.
If there is a downside break below 0.6665, the pair could extend its decline toward the 0.6650 zone. Any more losses might signal a move toward 0.6635 and the 76.4% Fib retracement.
On the upside, the AUD/USD chart indicates that the pair is now facing resistance near 0.6725. The first major hurdle for the bulls might be 0.6750. An upside break above 0.6750 might send the pair further higher. The next stop is near 0.6800. Any more gains could clear the path for a move toward 0.6850.
NZD/USD Technical Analysis
On the hourly chart of NZD/USD on FXOpen, the pair started a fresh increase from 0.5735. The New Zealand Dollar broke the 0.5780 barrier to start the recent rally against the US Dollar.
The pair settled above 0.5800 and the 50-hour simple moving average. It tested 0.5850 and is currently consolidating gains. There was a minor pullback below 0.5830. The NZD/USD chart shows that the RSI is now just above 50.
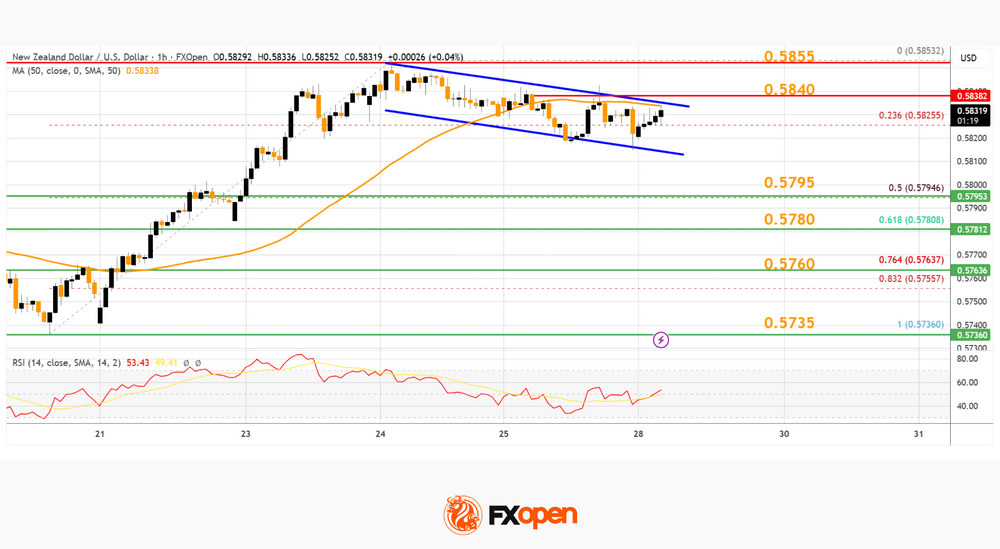
On the downside, immediate support is near the 0.5795 level and the 50% Fib retracement level of the upward move from the 0.5736 swing low to the 0.5853 high.
The first key zone for the bulls sits at 0.5780 and the 61.8% Fib retracement. The next key level is 0.5760. If there is a downside break below 0.5760, the pair might slide toward 0.5735. Any more losses could lead NZD/USD into a bearish zone to 0.5700.
On the upside, the pair might struggle near 0.5840 and an upper boundary of the bullish flag pattern. The next major resistance is near the 0.5855 level. A clear move above 0.5855 might even push the pair toward 0.5880. Any more gains might clear the path for a move toward the 0.5950 zone in the coming days.
Trade over 50 forex markets 24 hours a day with FXOpen. Take advantage of low commissions, deep liquidity, and spreads from 0.0 pips. Open your FXOpen account now or learn more about trading forex with FXOpen.
This article represents the opinion of the Companies operating under the FXOpen brand only. It is not to be construed as an offer, solicitation, or recommendation with respect to products and services provided by the Companies operating under the FXOpen brand, nor is it to be considered financial advice.


