
Silver broke higher in the past week, but failed to materialize a real breakout above the $92 highs established in early February.
Despite early risk-off price action, the precious metal pulled back from the resistance level.
With the latest news of a bilateral deal on the nuclear issue potentially close, according to the Iranian Foreign Minister, the risk-off premium built in throughout the morning is somewhat easing. It would be tough to make a case for a fundamental rally in the metal. It apparently wasn’t the final round of US-Iran talks, with the next round expected in Vienna on Monday.
We are concluding a rough month for metals, but they still maintain a solid outlook, having bounced off their early lows. Tomorrow’s close will be crucial.
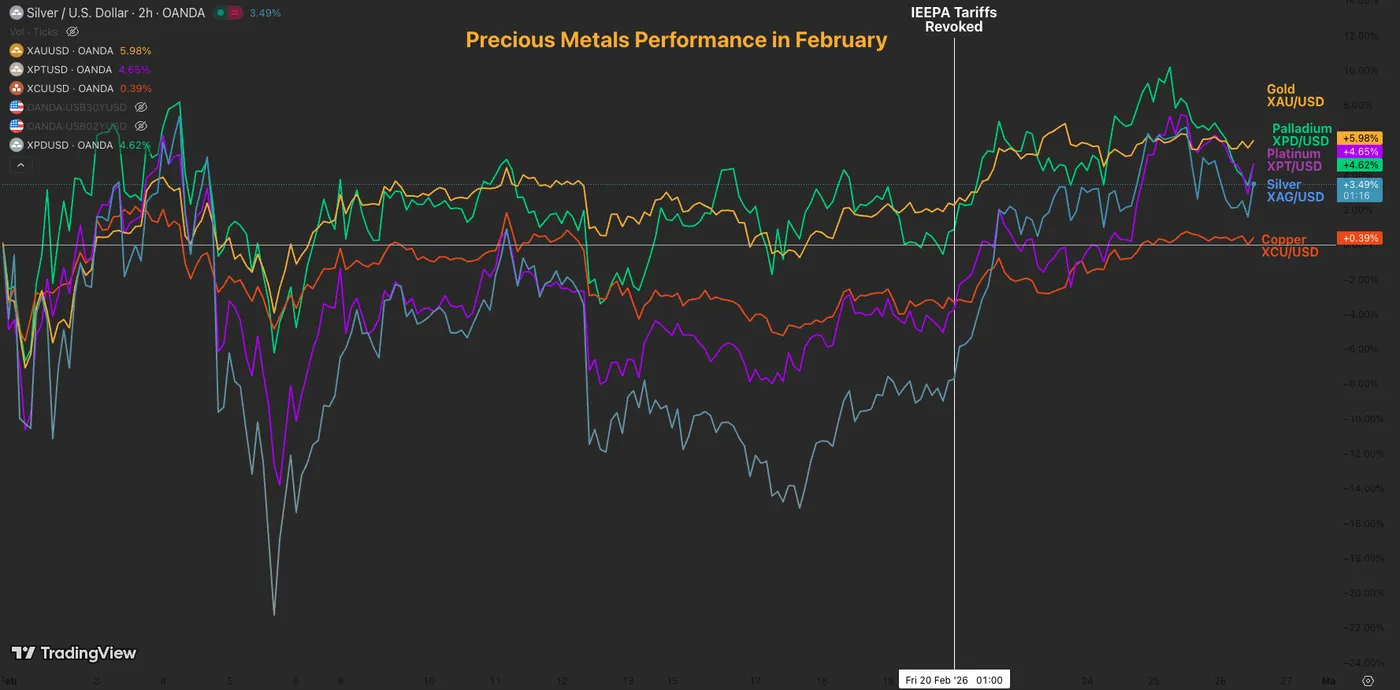
Metals performance in February – Source: TradingView
Still, bulls could find hope in the Chinese commodities Market pricing for the grey metal holding around $100 (Settled around $97 today).
In case you haven’t read our recent piece on the Paper vs Physical spread, go check it out!
The idea is that a $10 to $15 spread is within the norm, so nothing too shocking there also. It remains something to keep an eye on, particularly if physical demand takes a turn for the worse – no signs of this for now.
As fundamental uncertainty prevails, let’s check whether technicals help us assess whether there is indeed a direction to lean on or if range-bound conditions are actually taking over.
FYI, March isn’t the best seasonal month for Metals, but we are in unprecedented times. It could be wise to keep that in the back of your mind!
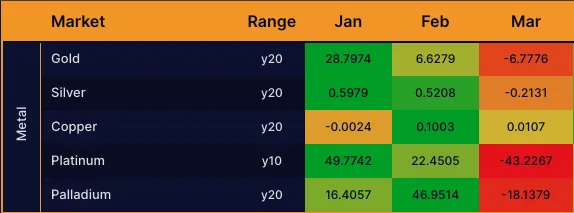
Metals seasonals through March – Source: Market-Bulls.com
Let’s dive into a Silver multi-timeframe analysis to identify the current course of action for the precious Commodity. Let’s get right into it.
Silver (XAG/USD) Multi-timeframe Technical Analysis
Daily Chart
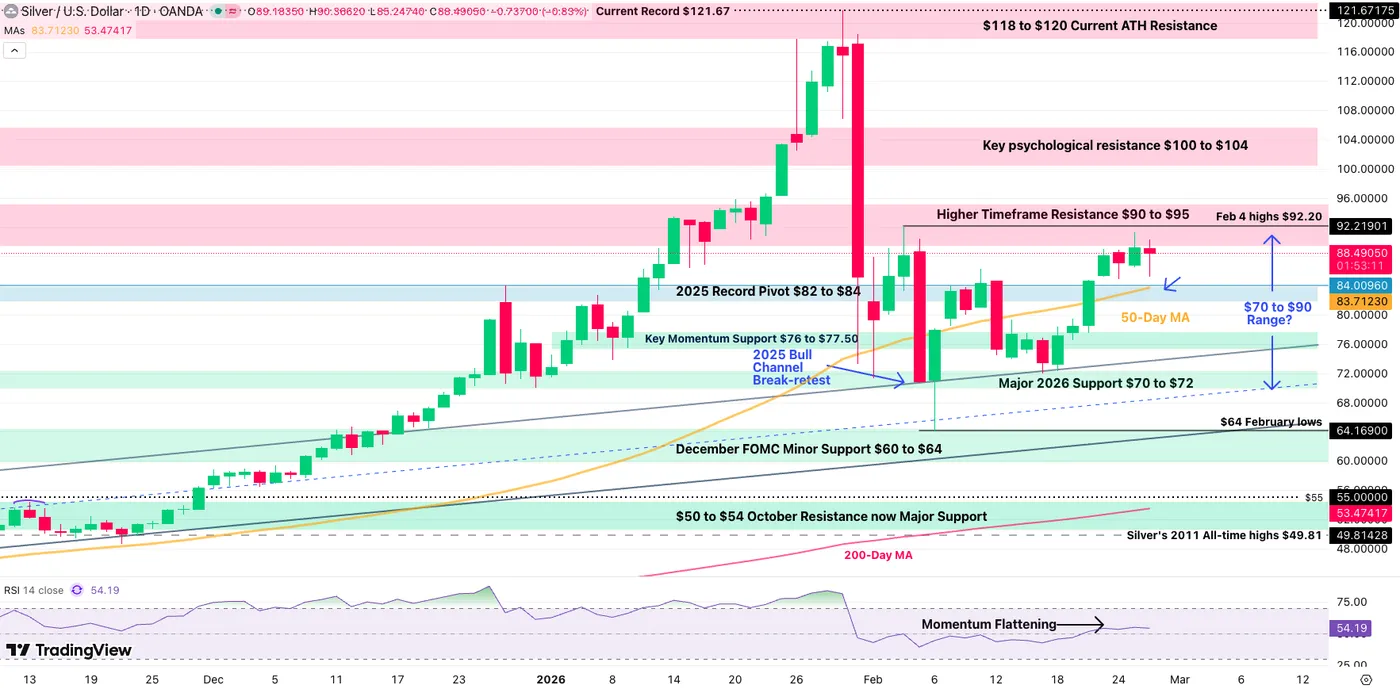
Silver Daily Chart, February 26, 2026 – Source: TradingView
Silver brought some high hopes after bouncing on its 2025 upward channel in a break-retest fashion, pointing to immediate upside.
But the reality is that bulls could not form a push above the Feb 4 highs around $92. Overall, the $90-$92 area will have to be breached to relaunch hopes to even reach $100.
Still, as long as the price action remains above the $82 – $84 Pivot, consolidation towards a breakout is still a favorable scenario for upside in the commodity – The flattening Daily RSI also points in that direction.
The 50-Day Moving Average is acting as key support at the significant $84 level, so keep a very close eye on whether prices hold above or below this. Let’s take a closer look.
4H Chart and Technical Levels
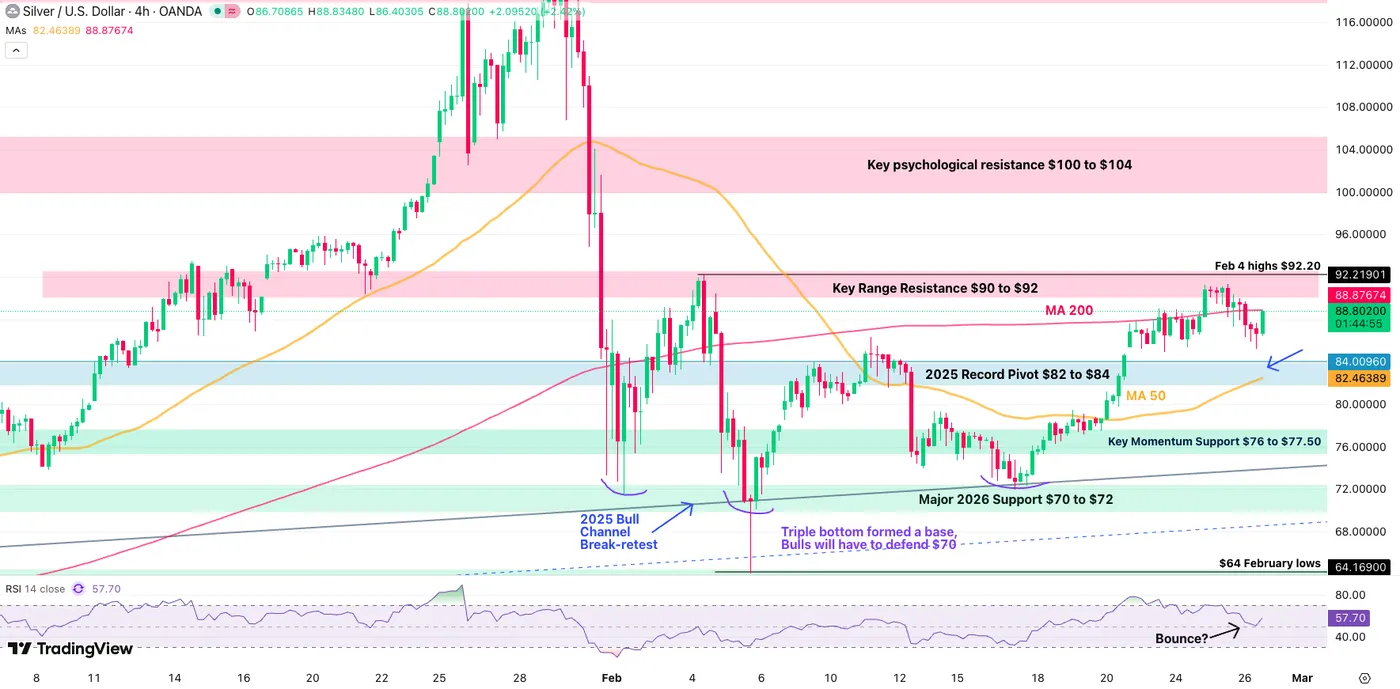
Silver 4H Chart, February 26, 2026 – Source: TradingView
Bulls are attempting a rebound in the immediate action but will have to face the 4H 200-period MA, acting as resistance for intraday action ($88.90).
A break above $92 will once again be necessary for a full breakout. Failing to do so hints at a retest of $84.
Levels to watch for Silver (XAG) trading:
Resistance Levels:
- 4H 200-MA $88.90
- Range highs $90 to $92
- Higher Timeframe Major Resistance $90 to $95
- Key psychological resistance $100 to $104
Support Levels:
Key Pivot $82 to $84
- intraday support $76 to $77.50
- Major 2026 Range Support $70 to $72
- December FOMC Minor Support $60 to $64 (Feb Lows)
- $50 to $54 Major Support
- October FOMC bottom $46.00 to $47.00
1H Chart
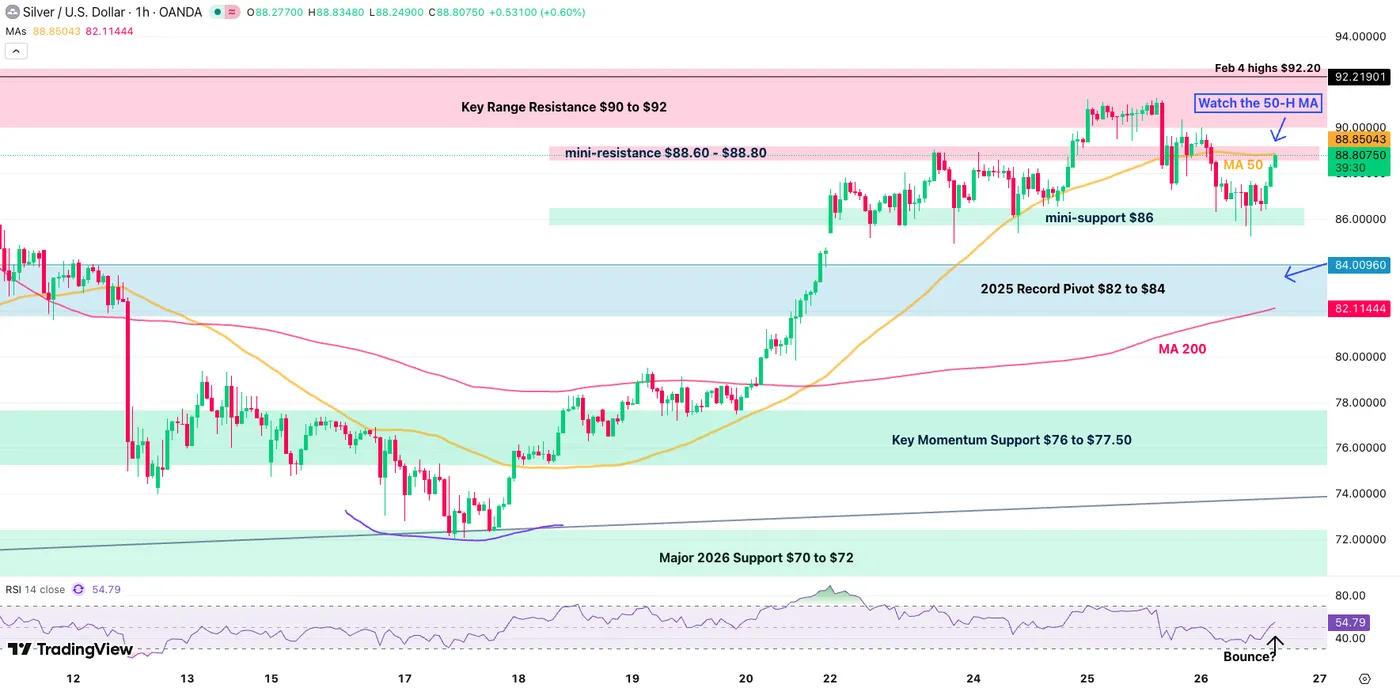
Silver 1H Chart, February 26, 2026 – Source: TradingView
Bulls are taking the lead on the shorter timeframes, attempting to tackle the 50H MA/4H 200 ($88.80) in the current bounce.
A mini-range is actually forming for consolidation traders:
- A 88.60 to $88.80 intraday resistance looks solid
- Breaking above hints at a quick test of the $92 resistance
- Any close above this would point to a $100.00 retest
- Breaking above hints at a quick test of the $92 resistance
- On the support side, look at $86.00 to $86.60
Safe Trades!


