
- US Stock Markets are continuing their breakouts to ever-fresher highs, but short-term profit-taking seems to be ruining the party
- The Dow Jones could retake 50,000 in today’s session barring no weekend-safety trading
- Exploring Technical Levels for the Dow Jones, Nasdaq and S&P 500
US Stock Markets have been on a rampage after this week’s earnings, and this trend is pushing Indexes to some new highs.
Yesterday saw the return of traditional assets demand, sweeping everything on their way and taking the Dow Jones up 1,000 points in one session, propelled by Caterpillar and Eli Lilly.
As the week concludes, the rally is now more broad based, with all US Indexes rising by similar percentages – Some signs of fatigue could be appearing, with some pullbacks from morning highs.
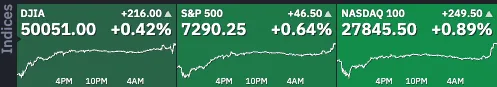
Daily Stock Market Index Performance – May 1, 2026. Source: TradingView
The only main concern that traders could see is the inability from Bulls to break the 50,000 level – If this level breaks in the afternoon session, this will bring with it further optimism signs for next week’s action.
Markets just received the US Manufacturing PMI report for April, and while it did not ease much, there are still concerns of the Index being driven by fears of supply droughts, hence pre-emptive orders all around the sector – The report came in at 52.7, the same as last month.
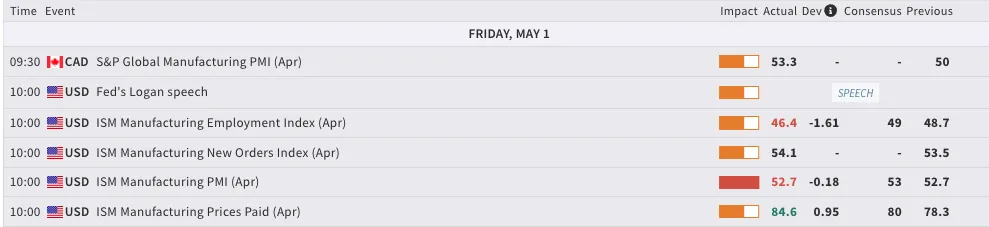
Manufacturing PMI Data – MarketPulse Economic Calendar
Overall, with the earnings season continuing to break records and the Federal Reserve reluctant to turn to hikes, the only catalyst left to bring Markets lower is the absence of solution between Iran and the US.
The situation has been in a deadlock since the first round of talks failed, with the Ceasefire extension bringing back some life into dull Markets but no solution on the horizon.
Crude Oil was falling off a cliff in early Morning trading but is not bouncing back higher, unable to break below $100 per barrel – Some concerns on that part, particularly with the price action looking more cloudy as the session continues.
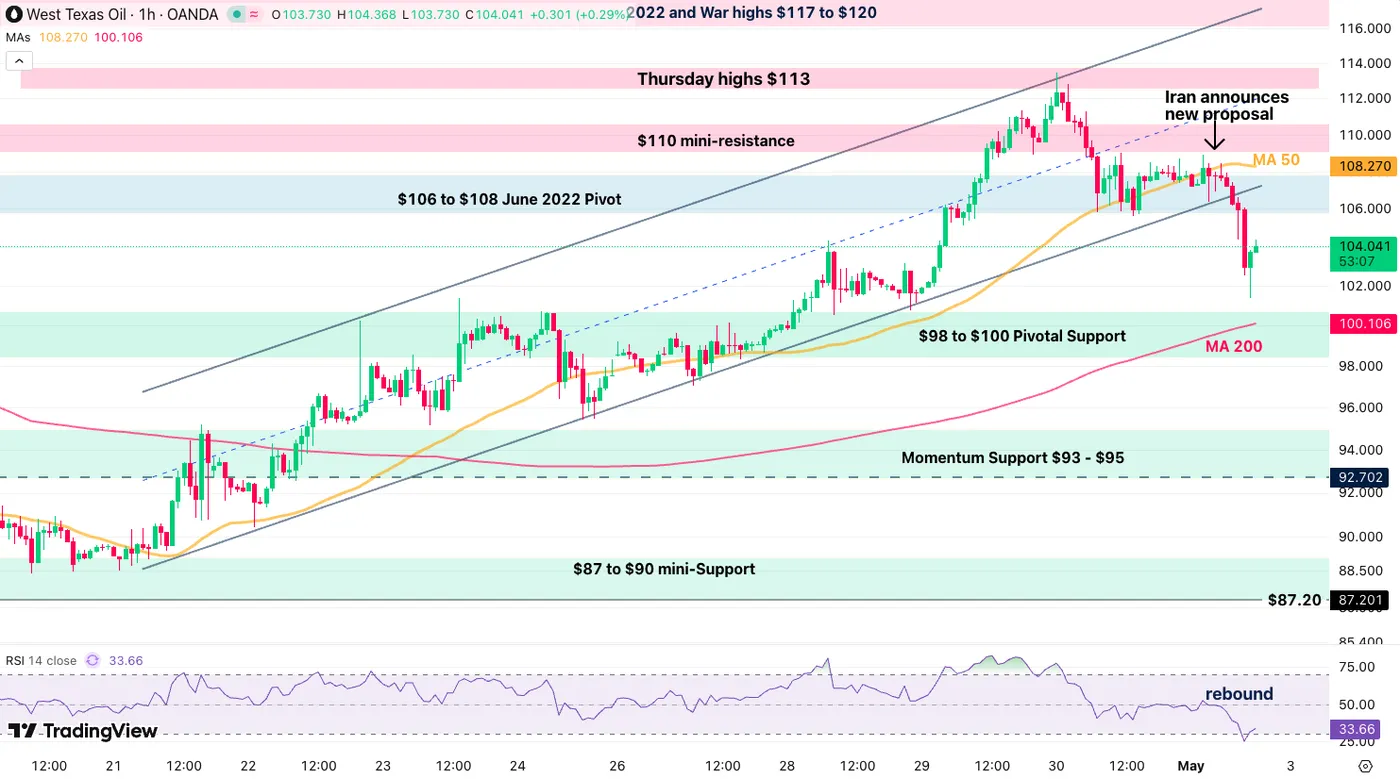
Crude Oil 1H Chart – May 1, 2026 – Source: TradingView
The drop in Crude Oil after the announcement of a new Iranian proposal has now begun to reverse to the upside – For Stock Markets to continue to rally, a break of the $100 level will be mandatory (look at the 200-Hour MA).
Let’s dive right into intraday charts and trading levels for the Dow Jones Industrial Average, Nasdaq Composite, and S&P 500.
Current Session’s Stock Heatmap
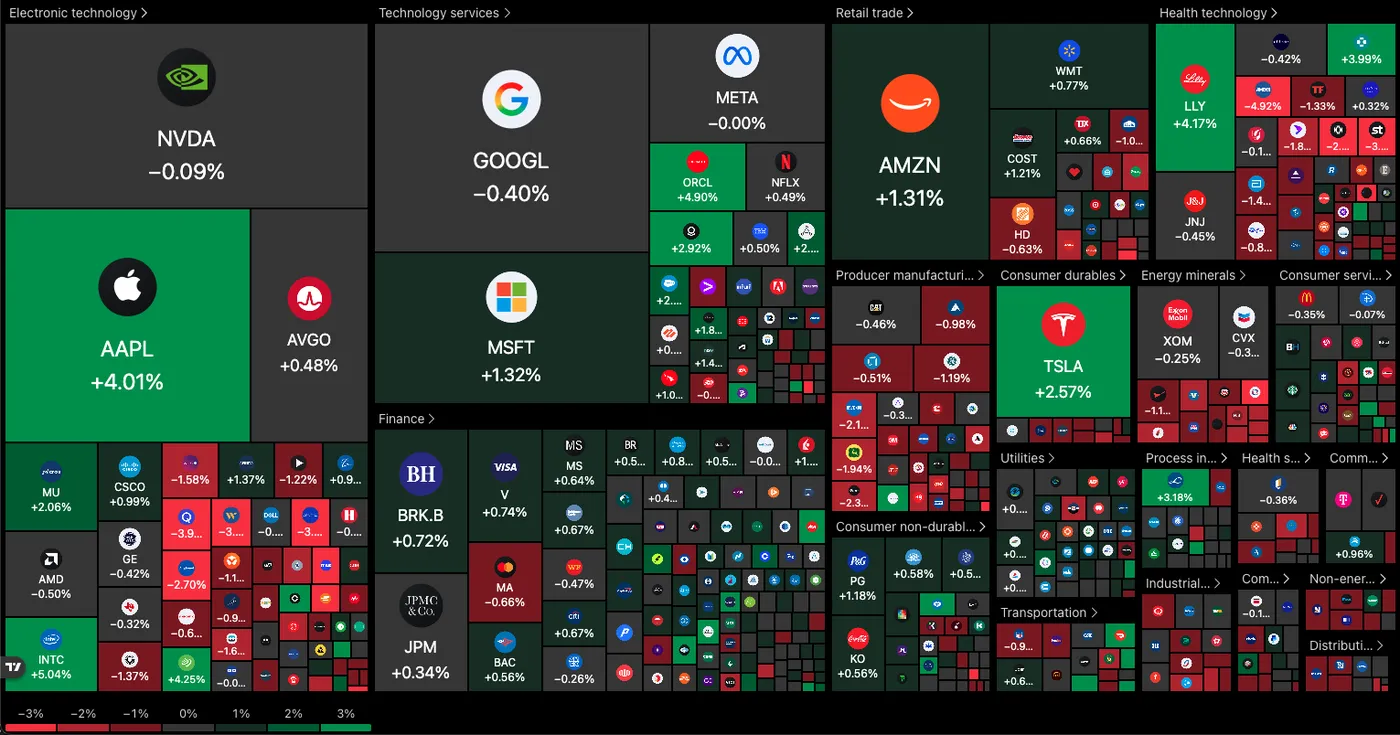
Current picture for the Stock Market (11:09) – Source: TradingView – May 1, 2026
The Stock Market is now back into hesitant trading territory – Healthcare, traditional manufacturing sectors and Energy are lagging after the Manufacturing PMI small miss.
Only a few names are doing the heavy lifting to pull Markets higher, including Apple, Oracle, Intel and Tesla.
Dow Jones 4H Chart and Trading Levels
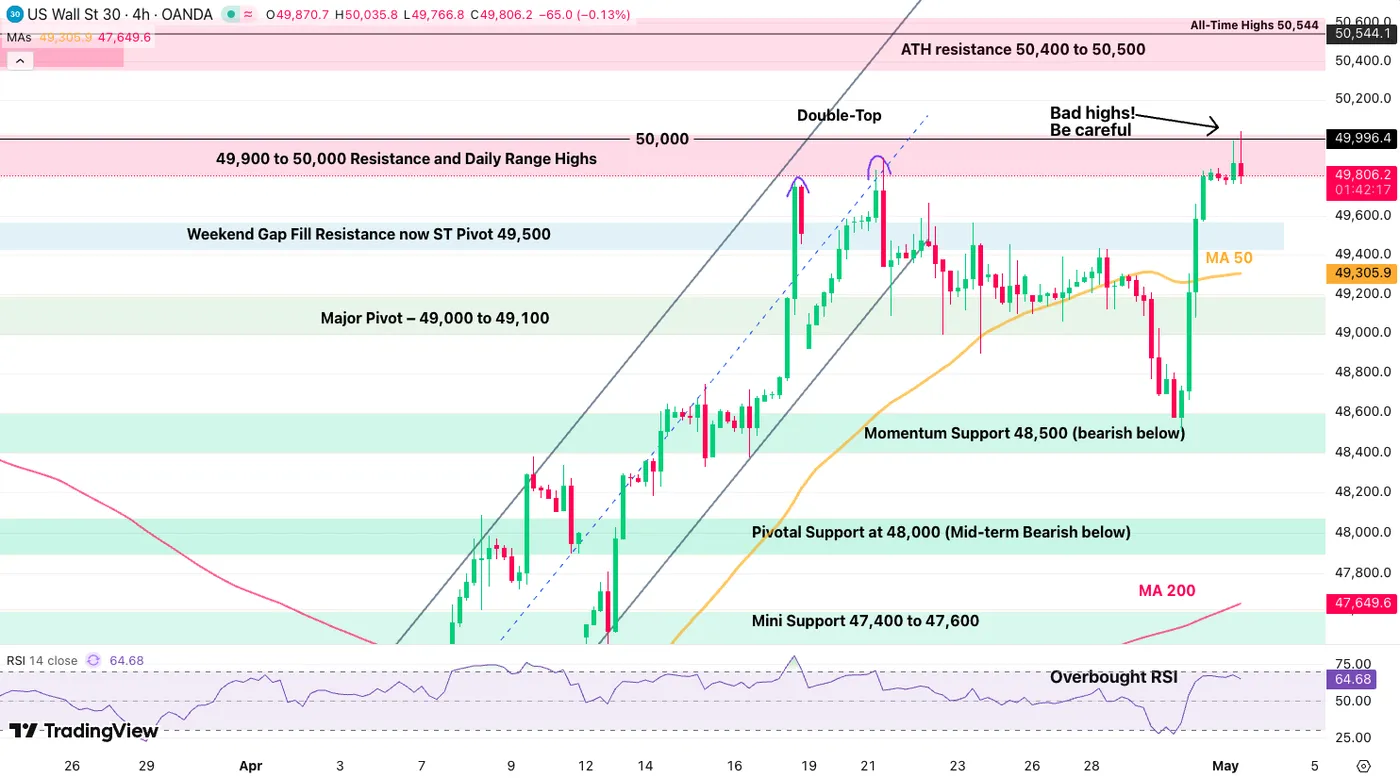
Dow Jones (CFD) 4H Chart – May 1, 2026 – Source: TradingView
After wicking very close to 50,000, the Dow Jones is forming an intraday nasty looking double top.
Sellers are taking control of the intraday momentum, so this could accelerate towards the late weekly session. A break of 49,750 could see further selling towards the 4H 50-period MA (49,300).
Dow Jones technical levels for trading:
Resistance Levels
- Morning highs 49,980
- 49,900 to 50,000 Resistance and Early 2026 Highs (rejecting)
- ATH resistance 50,400 to 50,500
- All-Time Highs 50,544
Support Levels
- 4H 50-period MA (49,300)
- Major Pivot – 49,000 to 49,200
- Momentum Support 48,500 (short-term bearish below)
- Pivotal Support at 48,000
- Mini Support 47,400 to 47,600
Nasdaq 4H Chart and Trading Levels
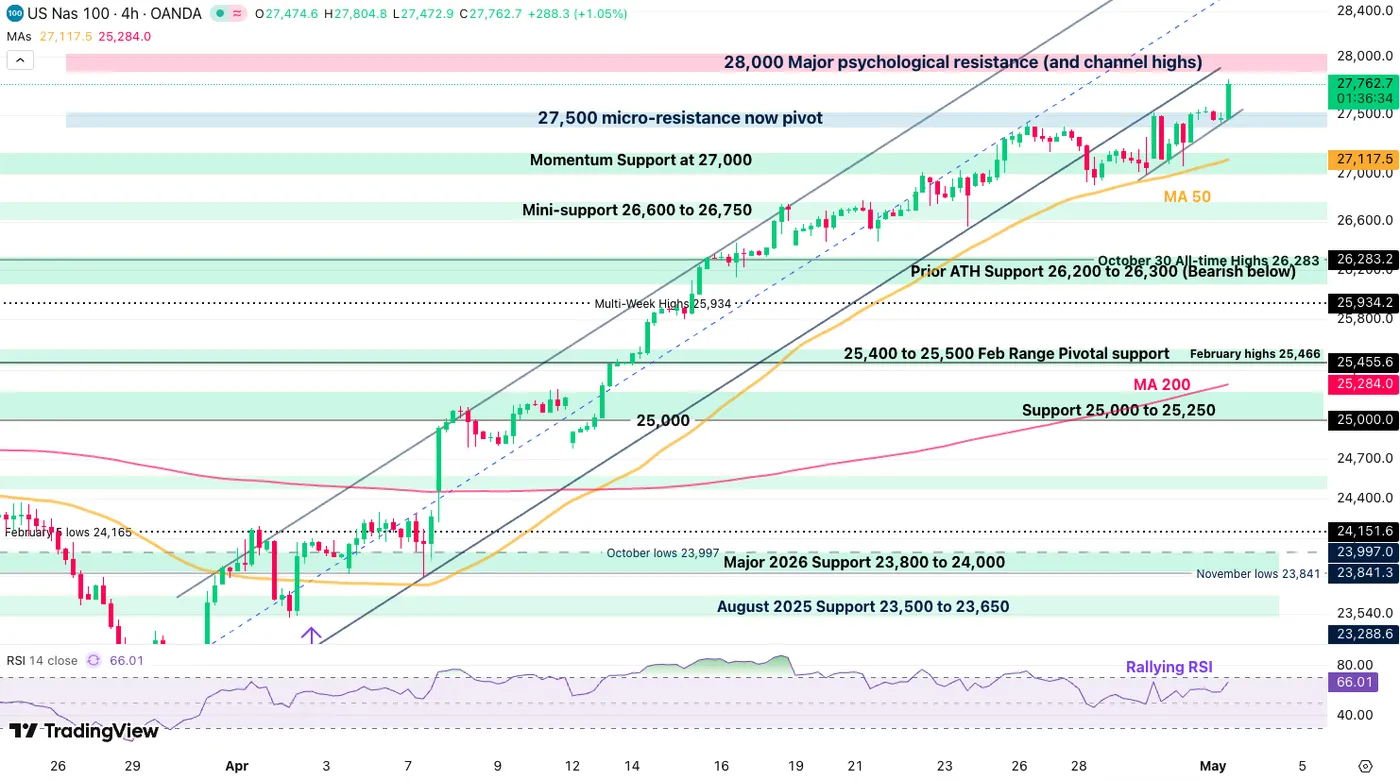
Nasdaq (CFD) 4H Chart – May 1, 2026 – Source: TradingView
Unlike the Dow Jones, Nasdaq hasn’t formed any sign of bearish reversal, running towards the 28,000 level, sustained by huge performance from Apple and Intel.
Check out reactions to the psychological level if the action manages to reach the level.
Any rejection below 27,500 could see a swift retest of the 27,100 4H 50-period MA – Watch out as reversals tend to happen fast these days.
Nasdaq technical levels of interest:
Resistance Levels
- 28,000 Major psychological resistance (and channel highs)
- Daily highs 27,850
Support Levels
- 27,500 micro-resistance now pivot
- Momentum Pivot at 27,000 (4H 50-period MA)
- Mini-support 26,600 to 26,750
- Prior ATH Support 26,200 to 26,300
- War Support 25,000 to 25,250
- Early 2025 ATH at 22,000 to 22,229 Support
S&P 500 4H Chart and Trading Levels
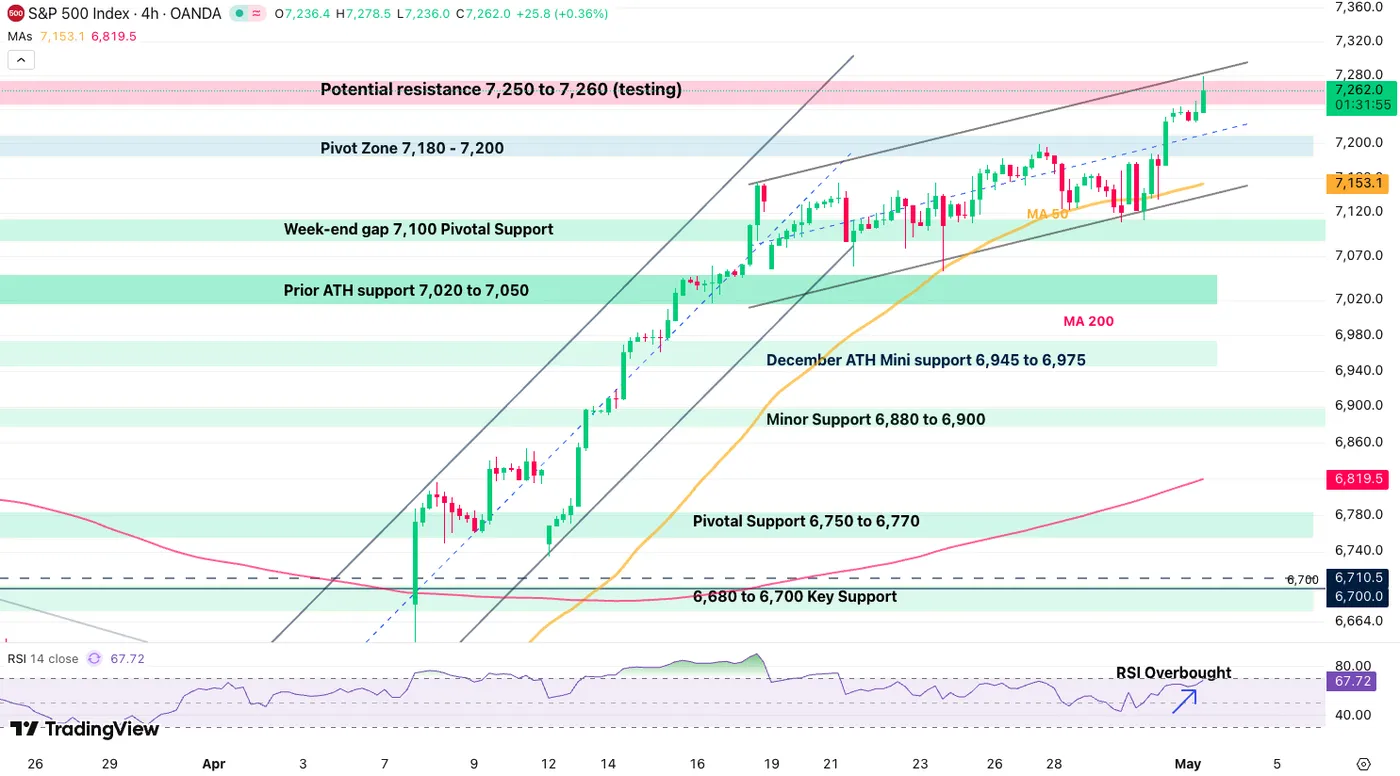
S&P 500 (CFD) 4H Chart – May 1, 2026 – Source: TradingView
The S&P 500 still evolves within its low-slope bull channel, and has now just tested its upper bound.
Momentum still looks strong for the index, but reaching overbought levels, it will be interesting to see if the Index resists to the pressure seen in the DJIA.
Above this, look for 7,300 – Rejecting here however hints at a test of the channel lower bound (7,150).
S&P 500 technical levels of interest:
Resistance Levels
- Mini-channel highs and daily top 7,260
- Potential resistance 7,300
Support Levels
- 7,100 psychological level and 4H 50-period MA
- Prior ATH Pivot 7,000 to 7,020
- Minor Support 6,880 to 6,900
- Pivotal Support 6,750 to 6,770
- 6,300 psychological level (War lows)
Keep track of WTI Crude and the latest headlines throughout the weekend to stay ahead of the curve, with investors still confused about US-Iran negotiations.
Safe Trades!


