
Key takeaways
- Geopolitical shock fuels haven flows: Escalating US-Iran conflict and fears over a Strait of Hormuz disruption triggered a “haven first” reaction—gold surged, WTI spiked above $70, US equities and Asian indices fell, while the US dollar firmed.
- Gold and oil in bullish breakouts: Gold maintains a short-term uptrend above $5,238 with scope toward $5,448/$5,602, while WTI crude has broken above major 30-month resistance at $70, opening upside toward $74.70–$78.10 unless $67.80 gives way.
- Equities pressured, AUD resilient: The Nikkei 225 risks a deeper correction below 57,140, while AUD/USD holds above 0.7030/0.7020 support, supported by strong commodities, with 0.7140 as the upside trigger.
The US, in collaboration with Israel, has launched an attack on Iran on Saturday, 28 February 2026, despite an attempt by Oman mediators to extend “diplomacy measures” for another round of negotiation talks over Iran’s nuclear stockpile.
The past 48 hours have seen a flurry of attacks from both sides, with Iran’s retaliation bombardments on US military assets spread across the Middle East in the United Arab Emirates, Kuwait, Bahrain, Qatar, Saudi Arabia, Jordan, and Oman.
The latest US-Iran conflict is likely not going to be a “symbolic attack” akin to last summer, as US President Trump said the US military will continue bombing Iran until his objectives are achieved, despite the confirmed death of Iran’s supreme leader, Ayatollah Ali Khamenei.
In today’s Asia session, market participants are generally adopting the strategy of “haven first, ask questions later” amid heightened concerns about the potential closure of the Strait of Hormuz by Iran, a key chokepoint for global oil flows, which can trigger an upward spiral in oil prices.
Here are the intraday performances of key asset classes at the time of writing:
- S&P 500 and Nasdaq 100 futures down around 0.9%
- Japan’s Nikkei 225 down 1.5%
- Hong Kong’s Hang Seng Index down 1.4%
- West Texas crude oil up 6% to around $71.40 per barrel
- Gold (XAU/USD) up 1.6% to around $5,360 per oz
- US Dollar Index up 0.3%
- Japanese yen down 0.5% to 156.80 per dollar
- Swiss franc almost unchanged at 0.7690 per dollar
- Bitcoin (BTC/USD) up 1.7% to around 66,880
Let’s look at the short-term technical outlook and key levels on Gold (XAU/USD), WTI crude oil, Nikkei 225, and AUD/USD.
Gold (XAU/USD) – Short-term uptrend remains intact above $5,238
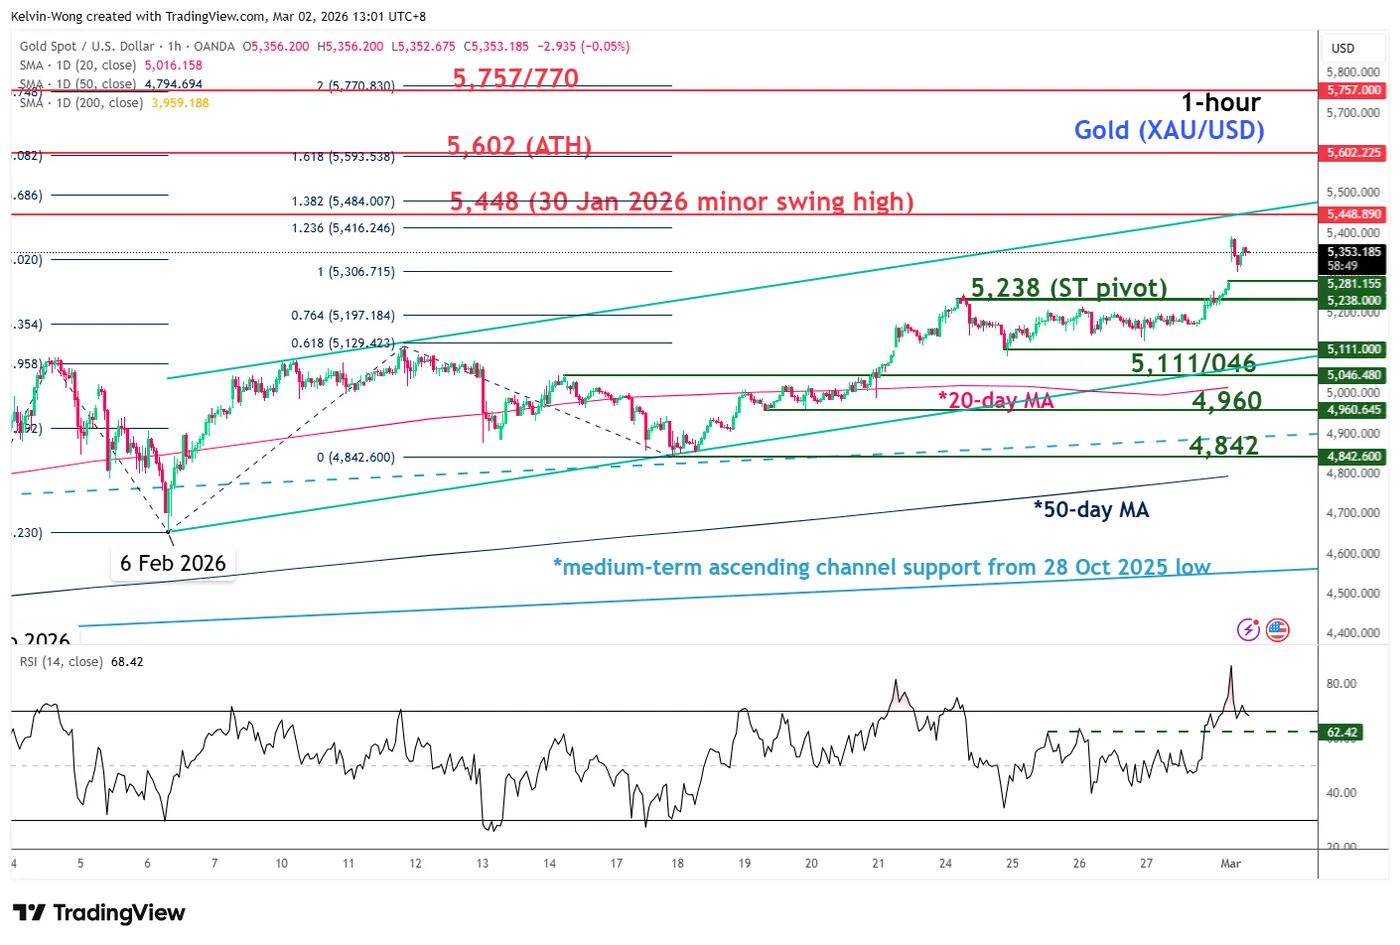
Fig. 1: Gold (XAU/USD) minor trend as of 2 Mar 2026 (Source: TradingView)
Price actions of Gold (XAU/USD) continue to oscillate within a minor ascending channel since the 6 February 2026 low of $4,655. Watch the $5,238 key short-term pivotal support for a further potential extension for the next intermediate resistance to come in at $5,448 before a retest at the current all-time high of $5,602 printed on 29 January 2026 (see Fig. 1).
However, a break and an hourly close below $5,238 negates the bullish tone for a minor corrective pull-back to retest the next intermediate support zone at $5,111/5,046 (also the 20-day moving average).
WTI Oil – Bullish breakout above 30-month major resistance at $70/barrel
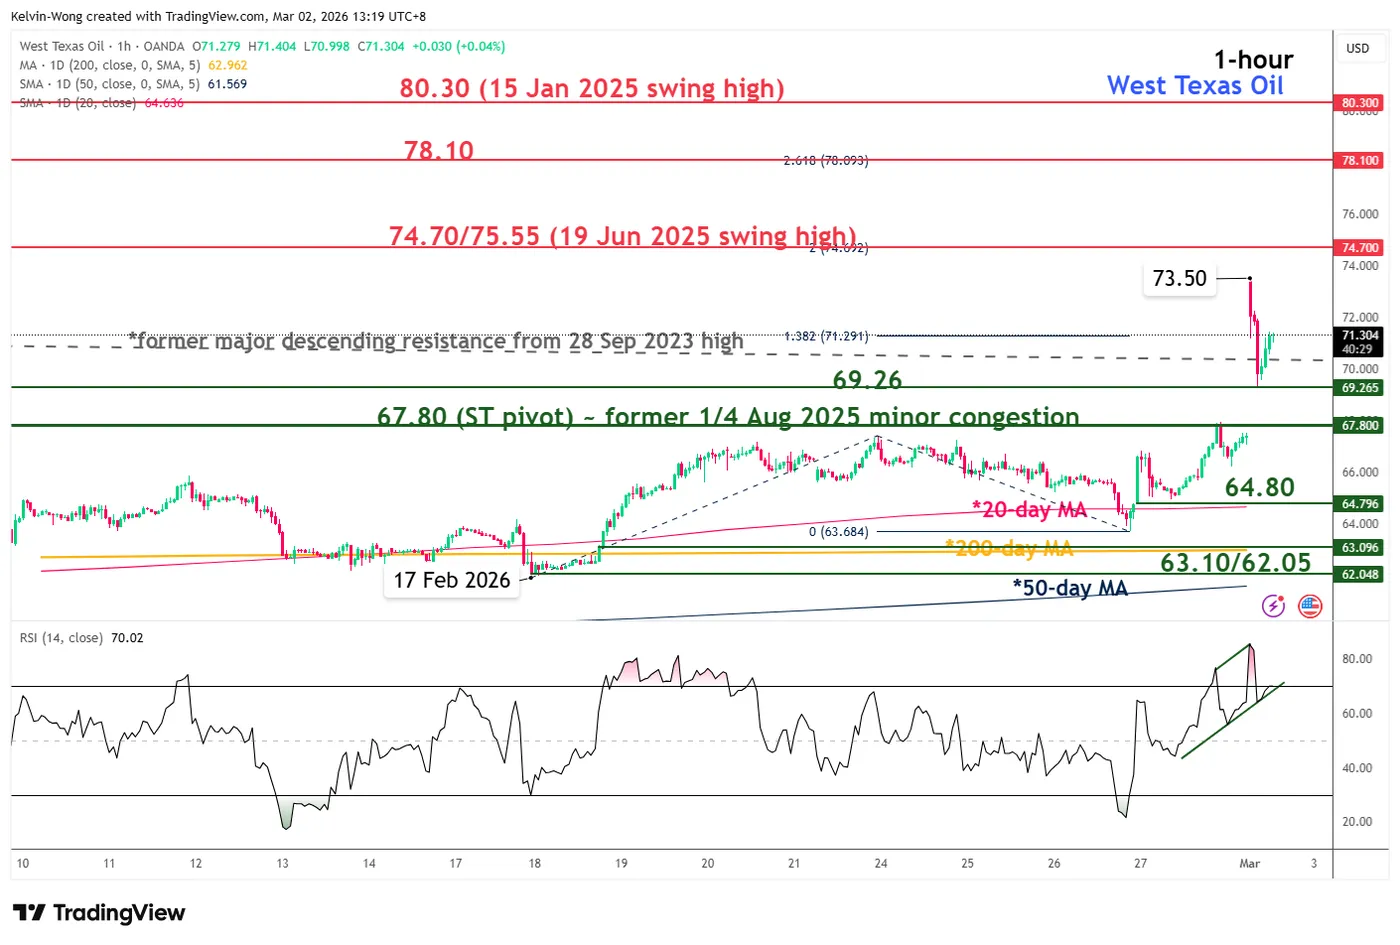
Fig. 2: West Texas Oil CFD minor trend as of 2 Mar 2026 (Source: TradingView)
The West Texas Oil CFD (a proxy of the WTI crude oil futures) has gapped up by 10% on Monday’s Asian opening hour to print an 8-month intraday high of $73.50/barrel before it pared back gains to around 6% to trade at $71.30.
Interestingly, today’s massive rally has triggered a major bullish breakout above its former 30-month major descending resistance from the 28 September 2023 high, which now turns into pull-back support at around $70.00/69.26 (see Fig. 2).
Watch the $67.80 key short-term pivotal support for the next intermediate resistances to come in at $74.70/75.55 and $78.10 (Fibonacci extension).
On the other hand, a break and an hourly close below $67.80 negates the bullish tone for another round of minor corrective pull-back to expose the next intermediate supports at $64.80 and $63.10/62.05 (also the area of the 50-day and 200-day moving averages).
Nikkei 225 – At risk of shaping a minor corrective decline, breaking below 57,140
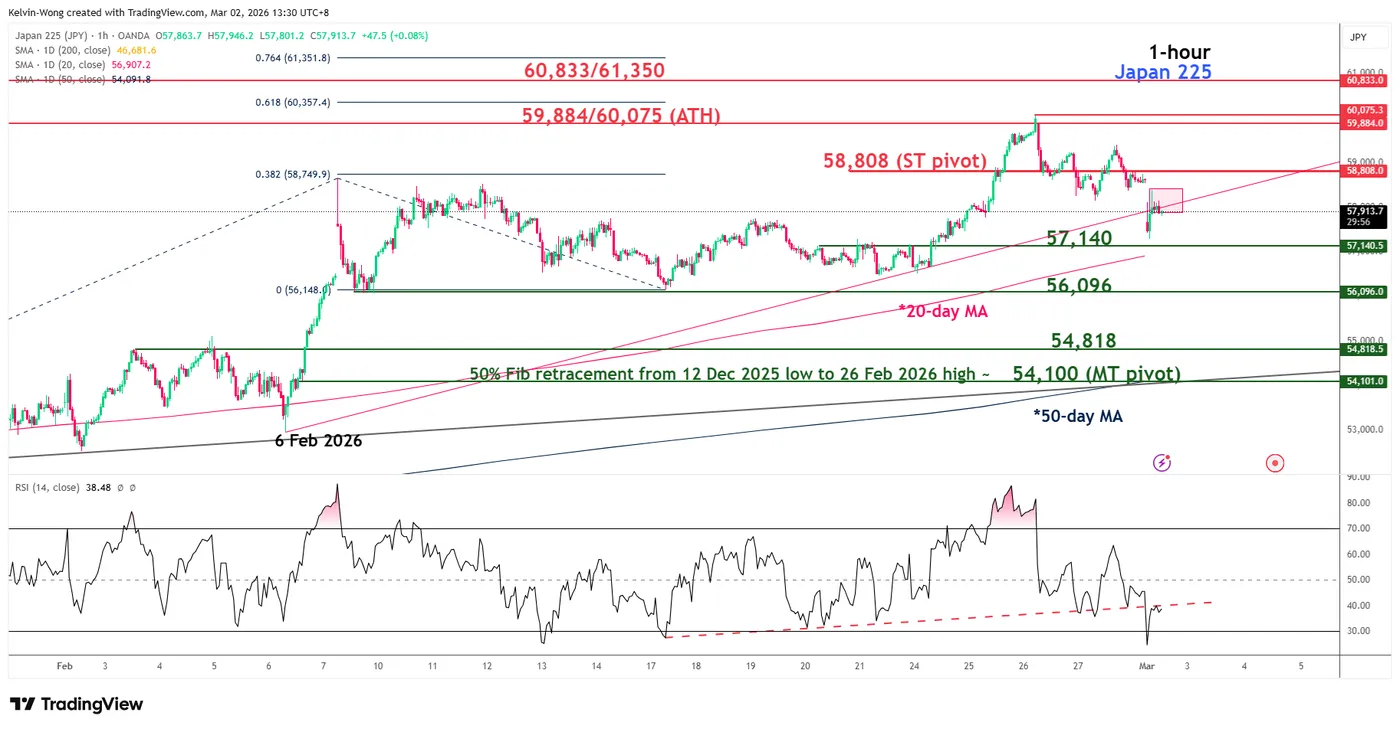
Fig. 3: Japan 225 CFD index minor trend as of 2 Mar 2026 (Source: TradingView)
The Japan 225 CFD index (a proxy of the Nikkei 225 futures) has gapped down by 2.3% in today’s Asian opening hour and shaped a bearish reaction at the time of writing right at the former minor ascending support from the 6 February 2026 low, now turns pull-back resistance at around 58,125 (see Fig. 3).
Watch the 58,808 key short-term pivotal resistance, and a break below 57,140 (also the 20-day moving average) may trigger a further minor corrective decline to expose the next intermediate supports at 56,096 and 54,818.
On the flip side, a clearance above 58,808 invalidates the bearish tone to see a retest at the all-time high area of 59,884/60,075 in the first step.
AUD/USD – Holding above the 20-day moving average and 0.7035/7020 support
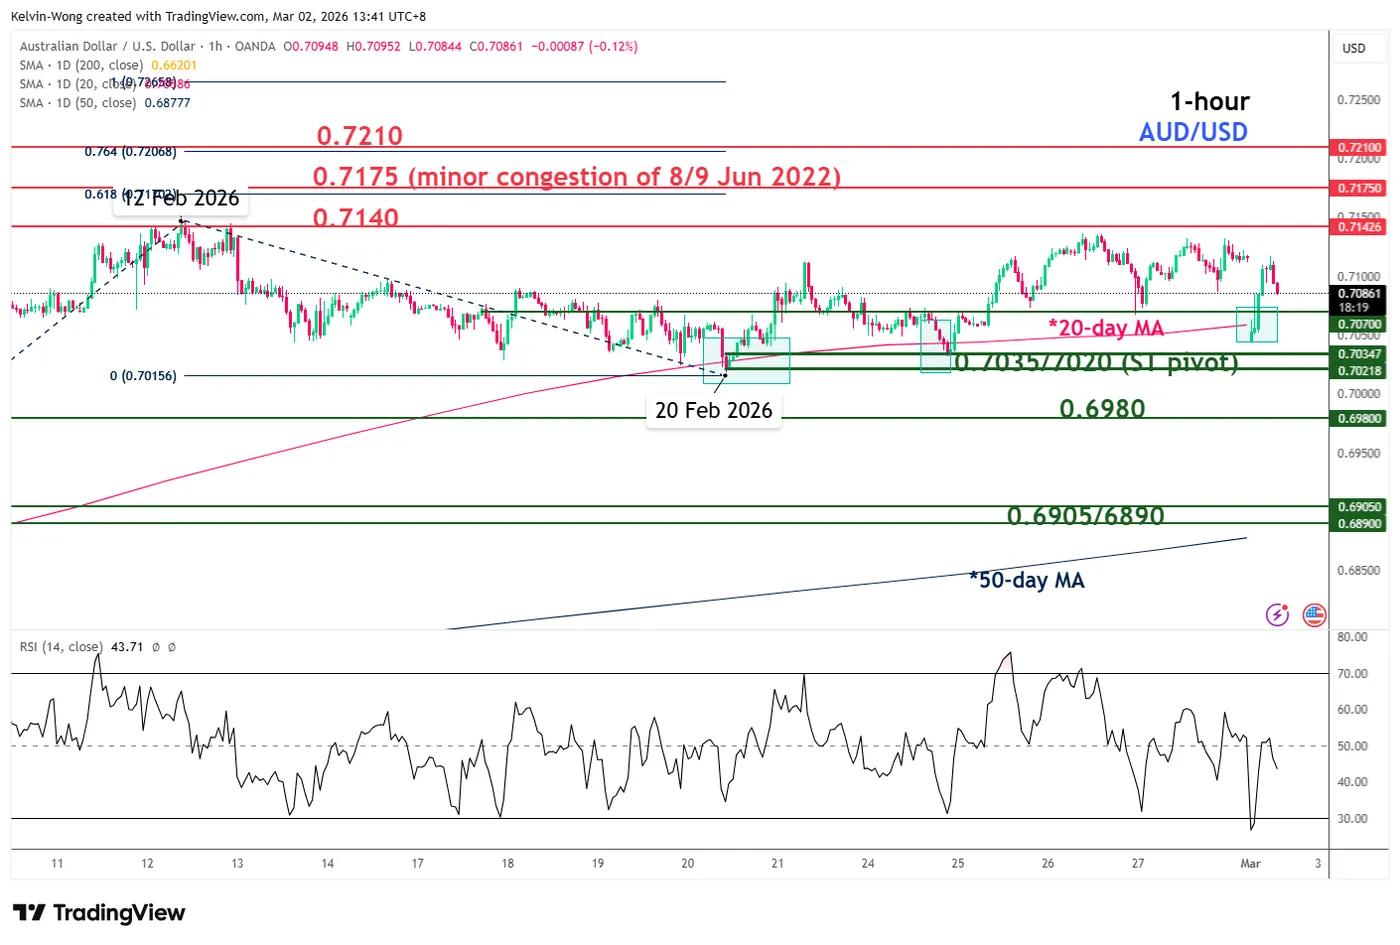
Fig. 4: AUD/USD minor trend as of 2 Mar 2026 (Source: TradingView)
The AUD/USD has managed to trim its intraday loss of 1% to 0.4% at the time of writing, supported by bullish commodities.
The intraday recovery seen in the AUD/USD has occurred right after the third retest on its 20-day moving average (see Fig. 4).
Watch the 0.7030/7020 key short-term pivotal support, and a clearance above 0.7140 may trigger another round of bullish impulsive up move sequences for the next intermediate resistances to come in at 0.7175 and 0.7210 (also a Fibonacci extension).
On the other hand, a break and an hourly close below 0.7020 invalidates the bullish tone for an extension of the minor corrective decline to expose the next supports at 0.6980 and 0.6905/6890 (also the 50-day moving average).


