
Key Highlights
- USD/JPY remained in a bullish zone and climbed above 158.00.
- A key bullish trend line is forming with support at 158.20 on the 4-hour chart.
- Bitcoin could form a base for a move above $72,000 and $72,500.
- Crude oil prices are again showing signs of strength for a move to $105.
USD/JPY Technical Analysis
The US Dollar remained supported at 156.50 against the Japanese Yen. USD/JPY started a fresh increase above 157.20 and 158.00.
Looking at the 4-hour chart, the pair settled well above 158.00, the 100 simple moving average (red, 4-hour), and the 200 simple moving average (green, 4-hour). There is also a key bullish trend line forming with support at 158.20.
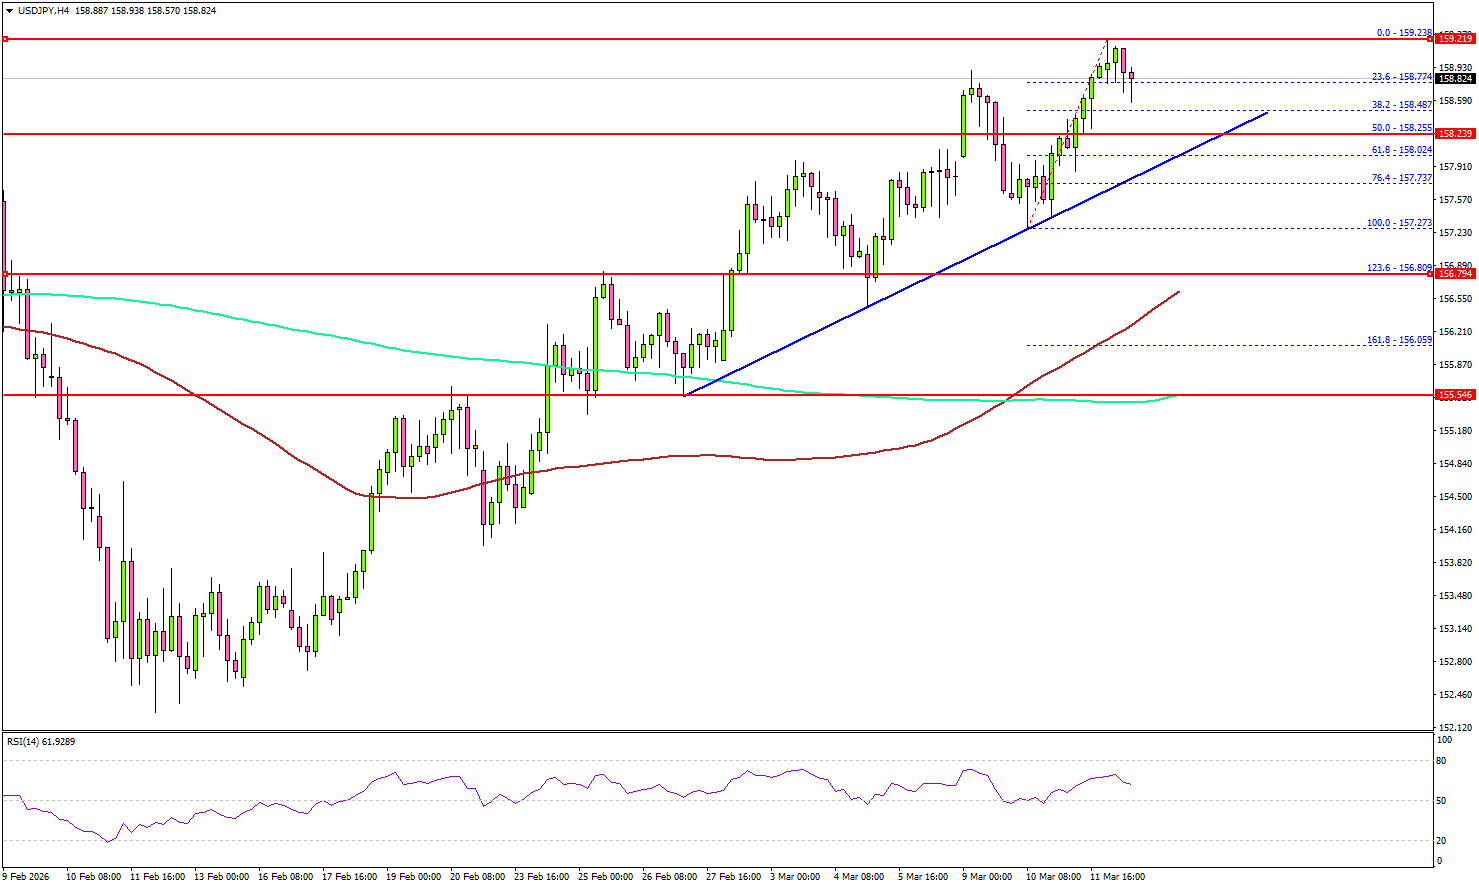
On the upside, the pair is now facing sellers near 159.20. The first major resistance sits at 159.50. A close above 159.50 could open the doors for gains above 160.00. In the stated case, the bulls could aim for a move to 162.00. Any more gain might open the doors for a test of 165.00.
If there is no upside continuation, the pair might start a downside correction. Immediate support is seen near 158.25, the 50% Fib retracement level of the upward move from the 157.27 swing low to the 159.23 high, and the trend line.
A close below the trend line support might send USD/JPY to 157.25. The main support sits at 156.80 and the 100 simple moving average (red, 4-hour), below which the pair might gain bearish momentum. In the stated case, it could even revisit 155.00 in the coming days.
Looking at Crude oil, the bulls seem to be active above $85.00, and they could soon aim for a fresh wave above $100 and $105.
Upcoming Key Economic Events:
- US Durable Goods Orders for Jan 2026 – Forecast +1.2% versus -1.4% previous.
- US Personal Income for Jan 2026 (MoM) – Forecast +0.5%, versus +0.3% previous.
- Michigan Consumer Sentiment Index for March 2026 (Prelim) – Forecast 55.0, versus 56.6 previous.


