
Key takeaways
- Downtrend confirmed, TACO rally likely a trap: Dow Jones Industrial Average has broken below its 200-day moving average and fallen ~10% from its peak, with the recent “TACO” (Trump Always Chickens Out) rebound likely a dead cat bounce rather than a sustainable reversal.
- Macro risks not fully priced by equities: The VIX/MOVE ratio signals that bond volatility is dominating, implying interest rate and stagflation risks remain underpriced in equities, leaving room for further downside.
- Key levels define next move: Immediate resistance sits at 46,710, while a break below 45,190 exposes further downside toward 44,975 and 44,505; failure to reclaim resistance keeps the bearish bias intact.
The price actions of the US Wall Street 30 CFD index (a proxy of the Dow Jones Industrial Average (DJIA) have tumbled as expected and broken below the key 200-day moving average on Wednesday, 18 March 2026.
On Monday, 23 March 2026, the US Wall Street 30 CFD index extended its bearish move to print an intraday low of 45,213 seen during the London session. All in all, it has plummeted by 10% from its current all-time high printed on 10 February 2026 to Monday’s 23 March 2026 low, reinforced by a flattening of the US Treasury yield curve triggered by rising stagflation risk due to global oil supply shock arising from the US-Iran war.
Risk-on behaviour roared back on Monday, 23 March 2026, after US President Trump sent a social media message that planned strikes against Iran’s energy infrastructure will be paused for five days as both sides are engaged in a renewed negotiation process, despite Iran’s repeated assertion that no direct negotiations have been held with the US.
The TACO regime, the popular acronym, “Trump Always Chickens Out,” has its footprints in the global financial markets yesterday, where market participants remembered the ex-post “Liberation Day” events in late April 2025, where Trump walked back on his aggressive tariffs and paused the US’s trade war 2.0 with China, inducing a V-shaped recovery in global stock markets.
Last year’s April “Liberation Day” TACO regime was a reaction to a sell-off in risk assets caused by “words” rather than actions, which are military strikes on stakeholders’ physical infrastructure in the current context, in turn, are likely to have lasting economic damages that cannot be easily reversed by a change of rhetoric from Trump.
Hence, Monday’s TACO-induced rally in risk assets is likely a fake head, also known as a dead cat bounce.
Intermarket analysis and technical analysis suggest that the medium-term V-shaped rally for the US stock market and global equities in general remains elusive now.
The VIX/MOVE ratio has not reached an extreme level on the upside
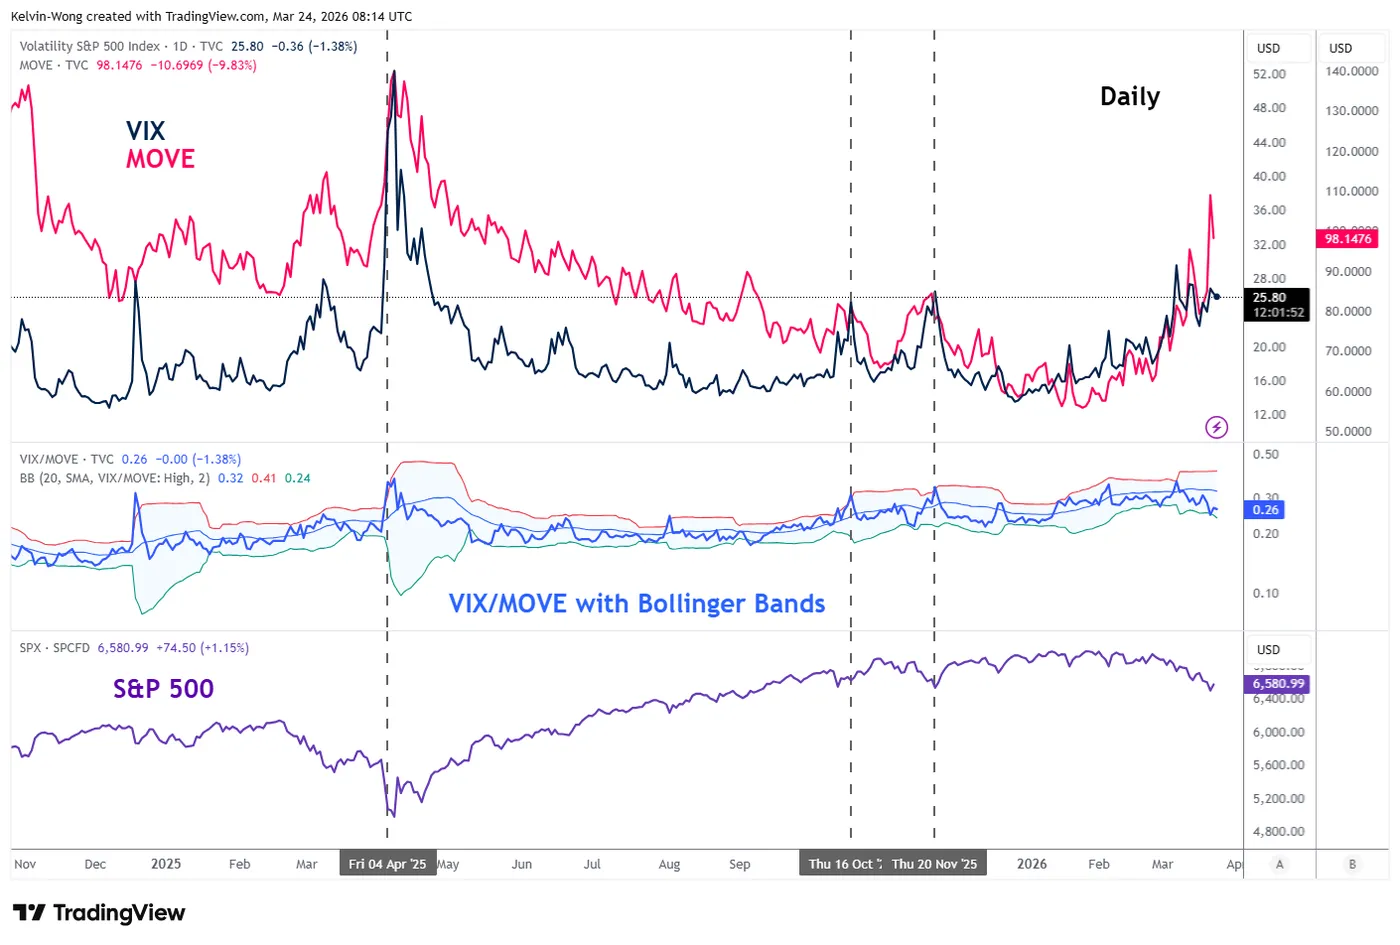
Fig. 1: VIX/MOVE ratio with S&P 500 medium-term trend as of 24 Mar 2026 (Source: TradingView)
The CBOE Volatility Index (VIX) is the implied volatility of the S&P 500, a gauge for US equities. On the other hand, the ICE BofA MOVE Index (MOVE) measures the implied volatility of US Treasuries.
Based on the latest price action of the VIX/MOVE ratio as of Tuesday, 24 March 2026, at the time of writing, it is trading below its 20-day moving average with a series of “lower highs and lower lows,” which suggests bond (US Treasuries) volatility is dominating, which implies interest rates uncertainty is the core driver at this juncture, and equity volatility is likely not fully pricing in such macro risk yet (may lead to more potential downside for US stock indices) (see Fig. 1).
Also, the VIX/MOVE ratio has not crossed above its daily Bollinger Bands’ upper limit, where such movements in the past led to or coincided with significant bullish reversals in the S&P 500 on 20 November 2025, 16 October 2025, and 8 April 2025 (see Fig. 1).
Let’s now decipher the short-term trajectory (1 to 3 days) of the US Wall Street 30 CFD index and its supporting elements from a technical analysis perspective
Dow Jones (DJIA) – Bearish reaction at 200-day moving average
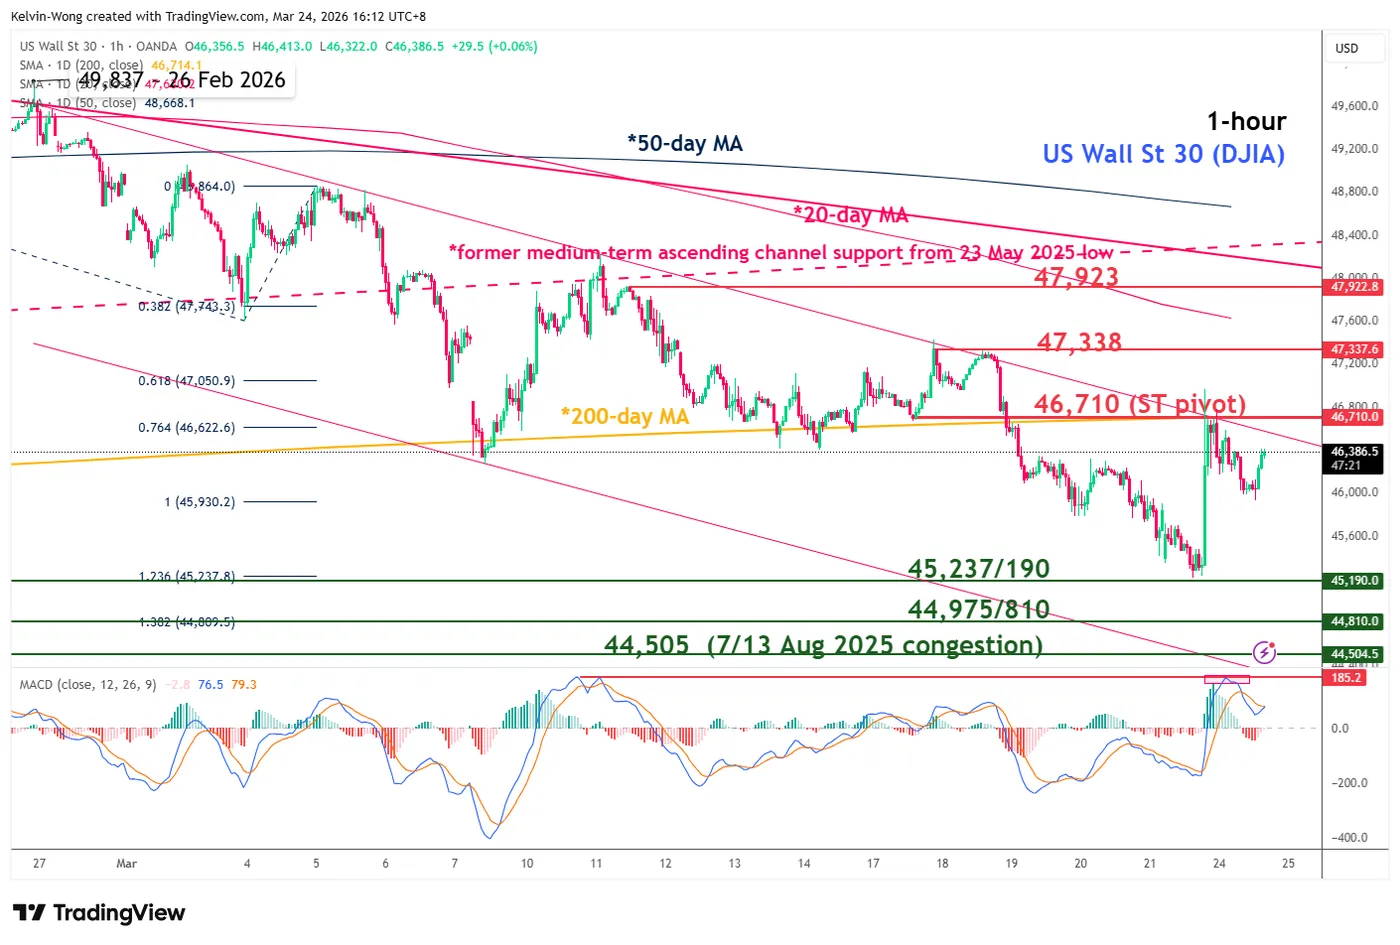
Fig. 2: US Wall Street 30 CFD index minor trend as of 24 Mar 2026 (Source: TradingView)
Watch the 46,710 key short-term pivotal resistance, and a break below 45,237/190 may expose the next intermediate supports at 44,975/810 and 44,505 (see Fig. 2).
On the other hand, a clearance above 46,710 invalidates the bearish reversal scenario for an extension of the mean reversion rebound towards the next intermediate resistances at 47,338 and 47,923.
Key elements to support the bearish bias on Dow Jones (DJIA)
- Yesterday’s rally stalled at the 200-day moving average and the upper boundary of the descending channel from the 26 February 2026 high.
- The hourly MACD trend indicator staged a bearish reaction at its horizontal resistance level.


 rebound likely a dead cat bounce rather than a sustainable reversal.)