
Key takeaways
- Downtrend intact despite policy support: AUD/USD failed to sustain gains after the hawkish RBA boost, reversing sharply from 0.7123 to a three-month low, with the bearish trend remaining intact below the 0.6910 resistance.
- Now driven by global risk sentiment: Rising stagflation fears and oil-driven macro stress have shifted AUD/USD into a “risk asset,” with stronger correlation to global equities—implying further downside if equity weakness persists.
- Key levels signal further downside risk: A break below 0.6838 may extend losses toward 0.6790–0.6710 (near the 200-day MA), while only a move above 0.6910 would invalidate the bearish outlook and trigger a rebound.
The price actions of the AUD/USD have staged the initial expected push up on 17 March 2025, ex-post RBA monetary policy meeting, where the Australian central bank offered a hawkish guidance of more interest rate hikes down the road in 2026 after it enacted a back-to-back rate hike of 25 basis points to increase the official cash rate to 4.1%.
The AUD/USD staged a rally of around 1% to print an intraday high of 0.7123 on 18 March 2026, which is within our predefined intermediate resistance zone of 0.7120/0.7140 highlighted in our previous analysis before it reversed by -4% to hit a three-month low of 0.6833 on Monday, 30 March 2026.
AUD/USD is now behaving like a “risk asset”
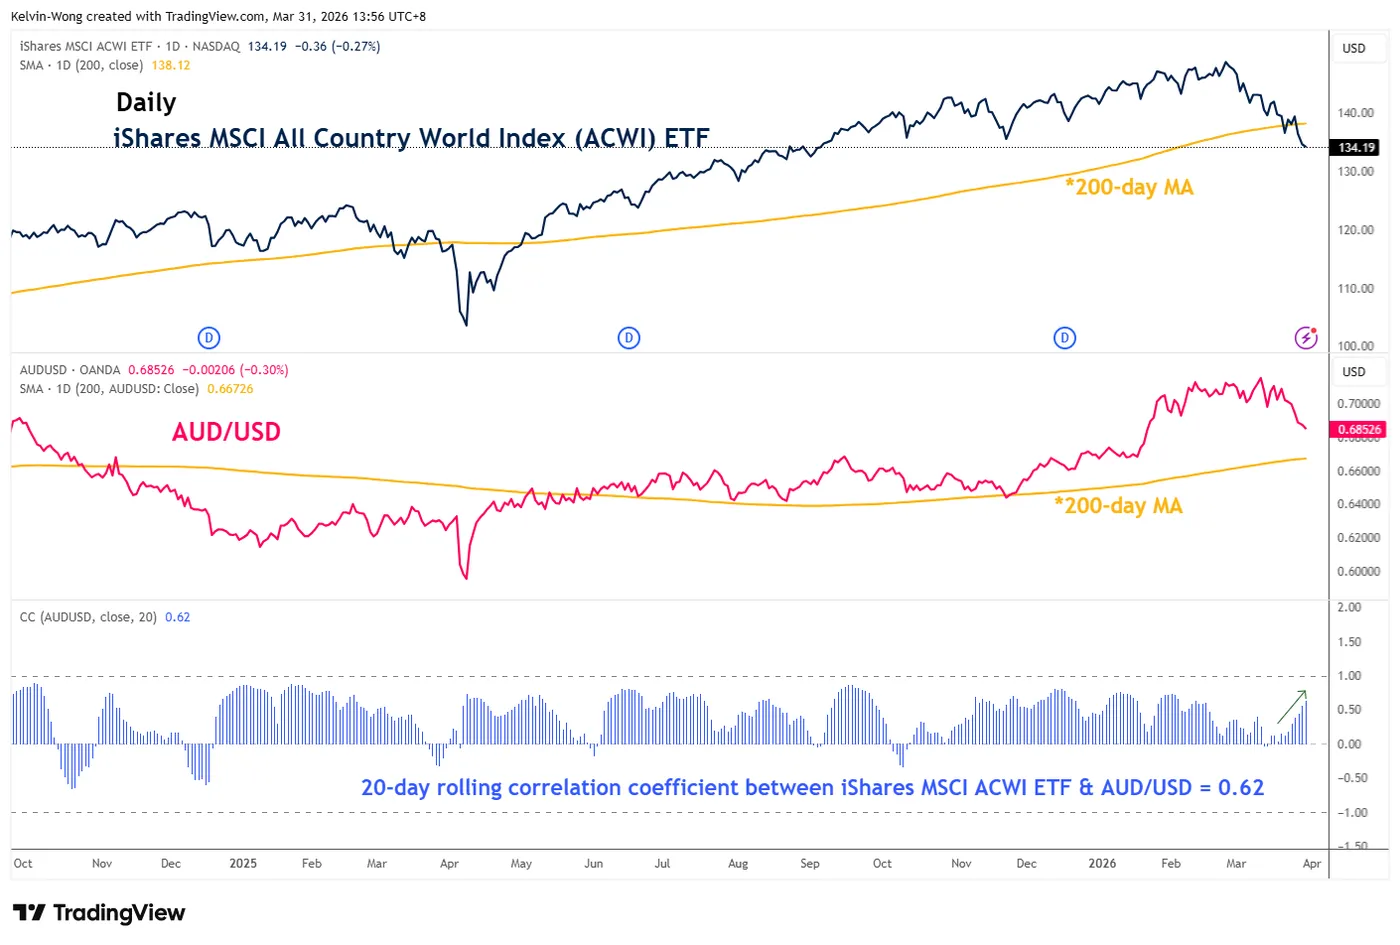
Fig. 1: Movement of iShares MSCI All Country World Index ETF with AUD/USD as of 31 Mar 2026 (Source: TradingView)
In the past two weeks, the stagflation risk narrative has gained traction due to higher oil prices, as global energy flow disruptions persist due to the US-Iran war, which shows no clear signs of de-escalation, damaging several Gulf states’ oil production and refinery assets.
Hence, the Australian dollar is now more sensitive to a significant deterioration in risk appetite triggered by heightened stagflation fear that overshadowed the “commodity currency” element.
Since mid-March 2026, the movement of the AUD/USD has been closely aligned with global equities.
The 20-day rolling correlation coefficient of the iShares MSCI All Country World Index (ACWI) ETF and AUD/USD has increased to 0.62 at this time of writing from 0.12 printed on 16 March 2026 (see Fig. 1).
Given that the ACWI ETF has just broken below its key 200-day moving average last week, which suggests more potential downside in the near to medium-term for global equities, in turn, it may trigger a further negative loop into the AUD/USD.
In today’s early Asian session, the Wall Street Journal has reported that US President Trump is willing to wind down the military campaign against Iran even if the Strait of Hormuz remains largely closed, signalling a potential shift in strategic priorities.
Overnight risk-off sentiment has stalled on this “conflicting” news flow, where the S&P 500 and Nasdaq 100 E-mini futures have erased earlier losses of around -0.5% at the opening hours of today’s Asian session to trade with an intraday of around 0.7% at this time of writing.
However, the AUD/USD remains muted and traded almost unchanged at the 0.6850 level.
Let’s now focus on the short-term trajectory (1 to 3 days) of the AUD/USD from a technical analysis perspective.
AUD/USD – More downside before potential bullish reversal at 200-day moving average
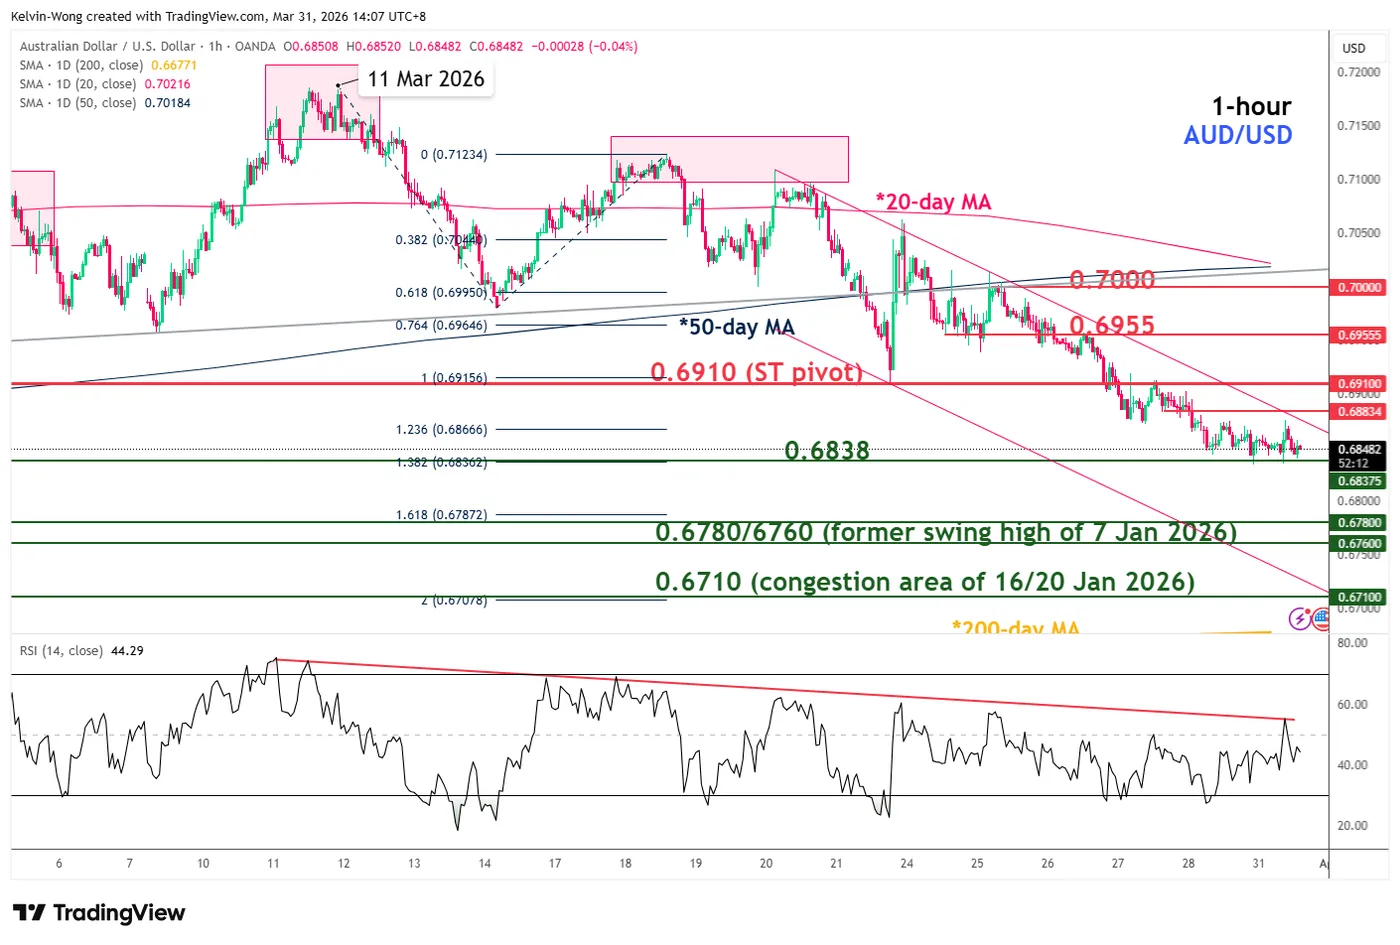
Fig. 2: AUD/USD minor trend as of 31 Mar 2026 (Source: TradingView)
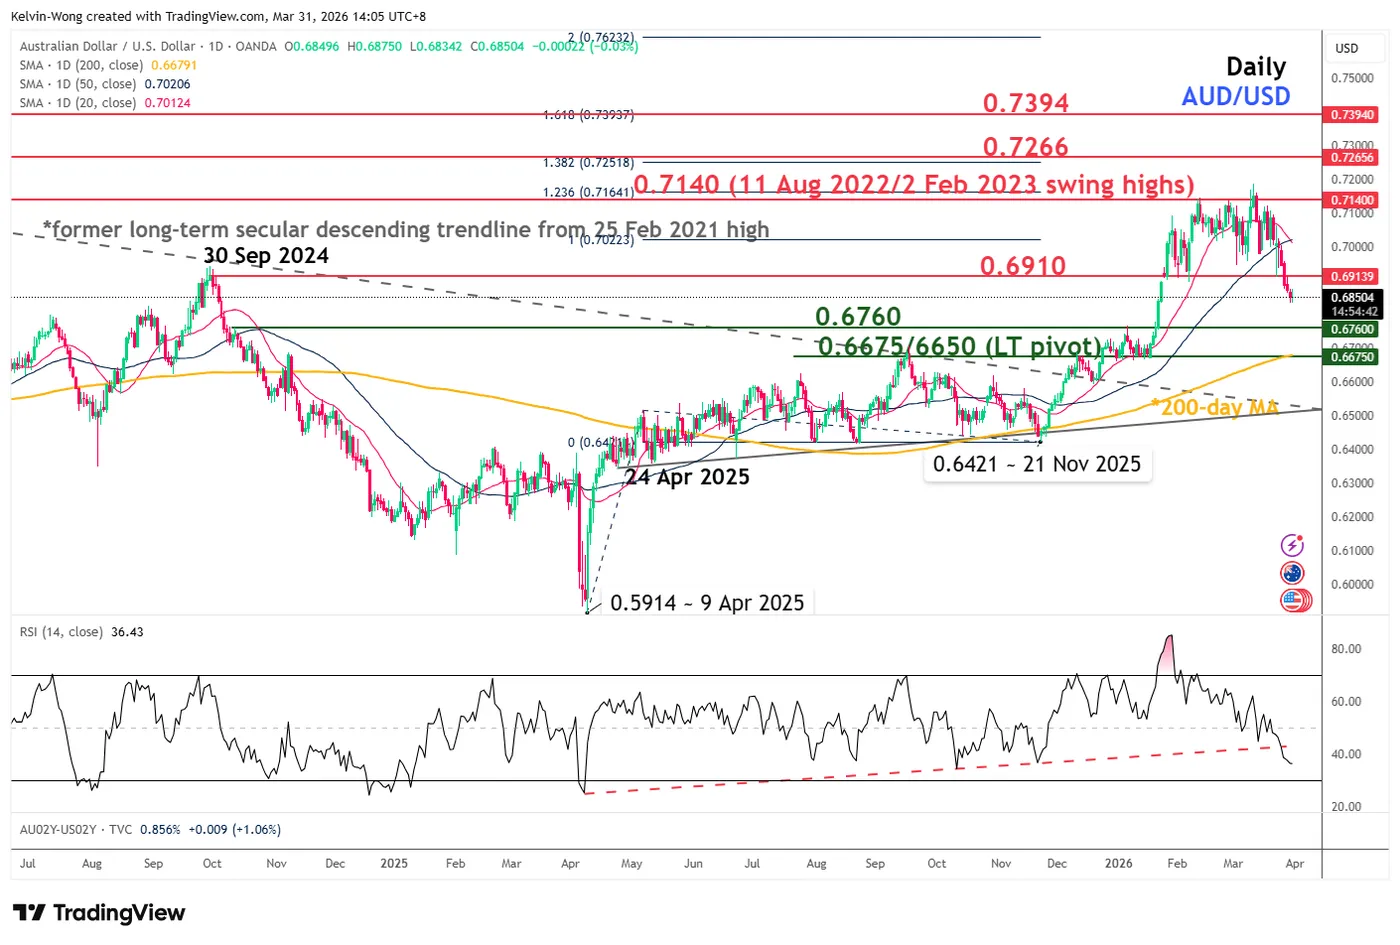
Fig. 3: AUD/USD medium-term & major trends as of 31 Mar 2026 (Source: TradingView)
Watch the 0.6910 short-term pivotal resistance (former medium-term pivotal support) to maintain a bearish bias.
A break below 0.6838 is likely to trigger the continuation of the minor bearish impulsive down move sequence to expose the next intermediate supports at 0.6790/6760 and 0.6710 (close to the key 200-day moving average) before a potential bullish reversal occurs (see Fig. 2).
On the other hand, a clearance above 0.6910 invalidates the bearish scenario for a mean reversion rebound towards the next intermediate resistances at 0.6955 and 0.7000 (close to the intersection of the 20-day and 50-day moving averages).
Key elements to support the short-term bearish bias on AUD/USD
- The price actions of AUD/USD have continued to oscillate within its minor descending channel in place since 20 March 2026, with its lower boundary coming in at around 0.6710 (see Fig. 2).
- The daily RSI momentum indicator of AUD/USD has broken below its key ascending trendline support and has not reached its oversold region (below 30) (see Fig. 3).


