
- The announcement of a tentative US-Iran ceasefire led to the “unwinding of the fear trade”.
- The S&P 500 and Nasdaq Composite both enjoyed a strong recovery, finishing green for seven consecutive trading sessions. History suggests this momentum is set to continue.
- The week ahead is dominated by central bank activity, specifically commentary from the RBNZ, employment data impacting the RBA’s decision, and the ECB’s balancing act on rate hikes.
The trading week was nothing short of a roller coaster, dominated by a dramatic shift in geopolitical sentiment that sent volatility through the energy and metals complexes. For much of the week, the primary narrative was the “unwinding of the fear trade” following the announcement of a tentative US-Iran ceasefire.
Oil was the biggest casualty of this cooling rhetoric. Brent crude, which had been knocking on the door of triple digits amid threats to the Strait of Hormuz, tumbled as much as 15% mid-week.
Gold, too, felt the pinch. After stalling at the $4,900 resistance level, the yellow metal saw its war premium erode, though it remains supported by a softer US Dollar. Speaking of the Greenback, the DXY is currently hovering near a critical “Golden Cross” support at 98.50.
OAU Share CFDs on MT5
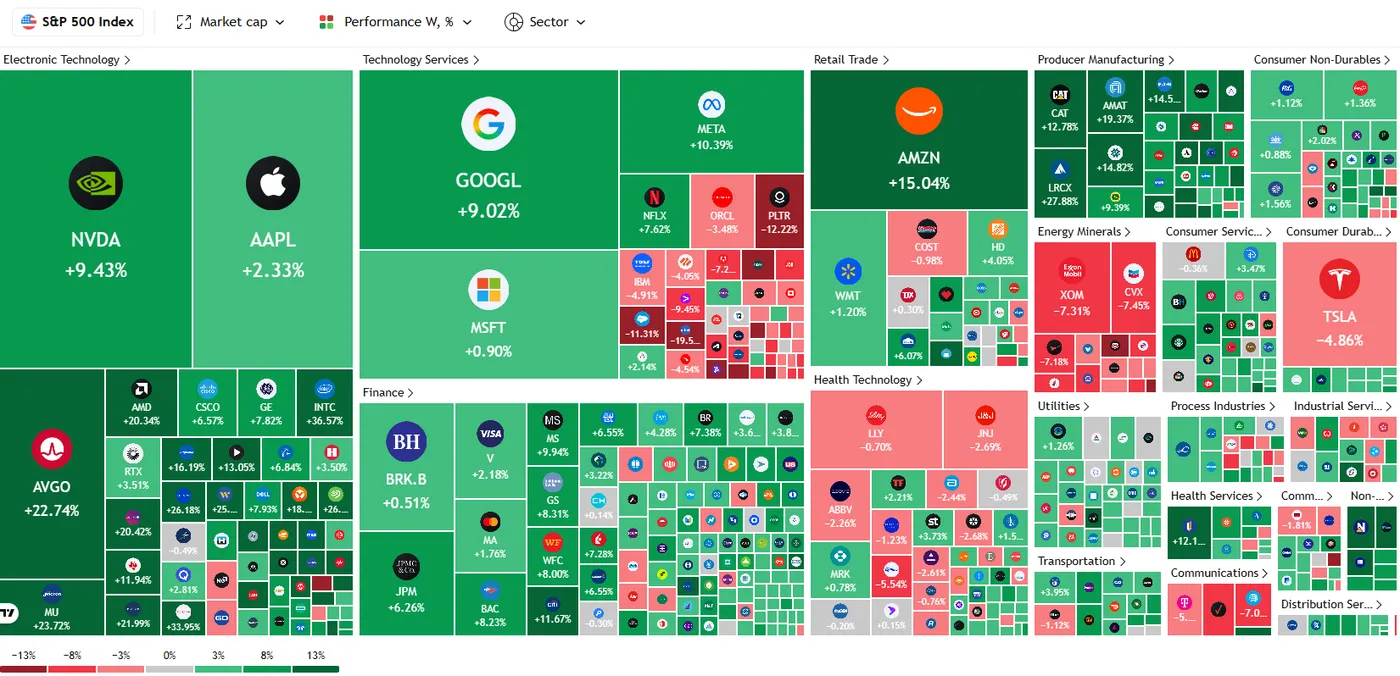
US equities enjoyed a strong recovery after the ceasefire news.The S&P 500 has finished green for 7 consecutive trading sessions, the longest streak since October 2025. The index has rallied +7.6% over this period, recovering nearly the entire war decline.
A similar 7-day stretch has also been recorded by the Nasdaq Composite, the longest since August 2025.
Source: TradingView
Since the 1950s, the market has seen a similar streak with at least a +7.0% gain only 9 other times, per Carson Investment Research.
Following this, the S&P 500 has been higher in 8 of those instances over the next month, with an average return of +4.4%.
Over the following 3 months, the market has been up in 7 instances and has gained +10.2% on average.
History suggests market momentum is set to continue.
This was despite US inflation data rising 0.9% MoM with headline inflation rising to its highest in 2 years. Inflation data had been the key data release this week and came in largely in line with estimates which left markets to focus on the geopolitical narrative as the week came to a close.
Heading into the weekend, markets are rather optimistic as the US-Iran prepare for talks in Pakistan scheduled to start on Saturday. The talks will likely have a massive impact on whether markets kick the new week off on a risk off or risk on tone.
The Week Ahead: Central Banks in the Crosshairs
Here is the summary of what I will be watching for next week in Asia, the US, Eurozone (EU), and UK with a quiet week expected from an economic data perspective.
China & Japan: Asian Resilience?
In China, market participants will be monitoring trade data and liquidity injections from the PBoC. With global growth concerns lingering, any sign of domestic stimulus will be welcomed by equity bulls. In Japan, the Nikkei 225 remains on a knife-edge. We are watching the 50-day Moving Average closely; a sustained break below this level could confirm bearish breakdown conditions, especially if JPY strength persists as a safe-haven play.
Australia & New Zealand: RBA and RBNZ in Focus
The NZD/USD is currently testing major support at 0.5700. The upcoming RBNZ commentary will be pivotal; a dovish tilt here could see the Kiwi break lower. Across the Tasman, Australia’s employment data will provide the RBA with the ammunition needed to decide if they can afford to pause or if the inflationary spillover from energy costs requires one more hike.
Europe & UK: The ECB’s Balancing Act
Despite the ceasefire, European equities have remained cautious. The ECB is still pricing in two rate hikes, fueled by the lag effect of energy prices on core inflation. We’ll be watching the Euro (EUR/USD) to see if it can capitalize on a potentially stalling Dollar or if the Eurozone’s sluggish growth outlook keeps a lid on any rallies.
The US: Geopolitics in focus as data remains light
A very quiet week in the US with the Fed’s Beige Book the highlight of the week. Markets are likely to be more engrossed by developments around the weekend talks with Iran and how that might shape markets and the US dollar in the week ahead.
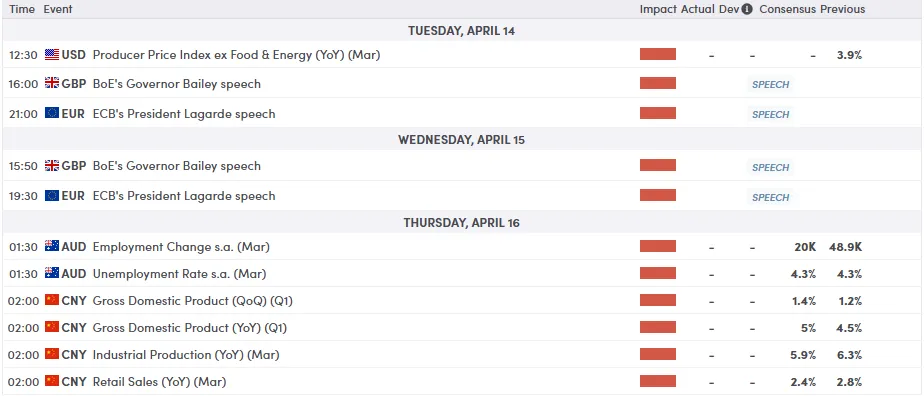
For all market-moving economic releases and events, see the MarketPulse Economic Calendar. (click to enlarge)
Chart of the Week – Nasdaq 100
From a technical standpoint, The Nasdaq 100 (US100) is currently exhibiting a strong bullish reversal after finding significant support near the 22,800 handle in late March.
The index has staged an impressive breakout above the descending trendline that has constrained price action since the February peaks, signaling a shift in momentum.
This trendline (channel) breakout sets the index up for a potential move of 2000-odd points to the upside, around the 26500 handle.
Currently, price is wrestling with the 100-day Simple Moving Average (red line) at 25,013, which coincides with a structural resistance level. A daily close above this zone would clear the path for a retest of the 25,320 horizontal barrier.
The RSI (14) is trending upward at 60.9, suggesting there is still room for further gains before reaching overbought territory.
However, traders should watch for potential pullbacks toward the 200-day SMA (yellow line) at 24,568, which now serves as a key dynamic support. A failure to hold above this level would negate the recent breakout.
NASDAQ 100 Daily Chart, April 10, 2025
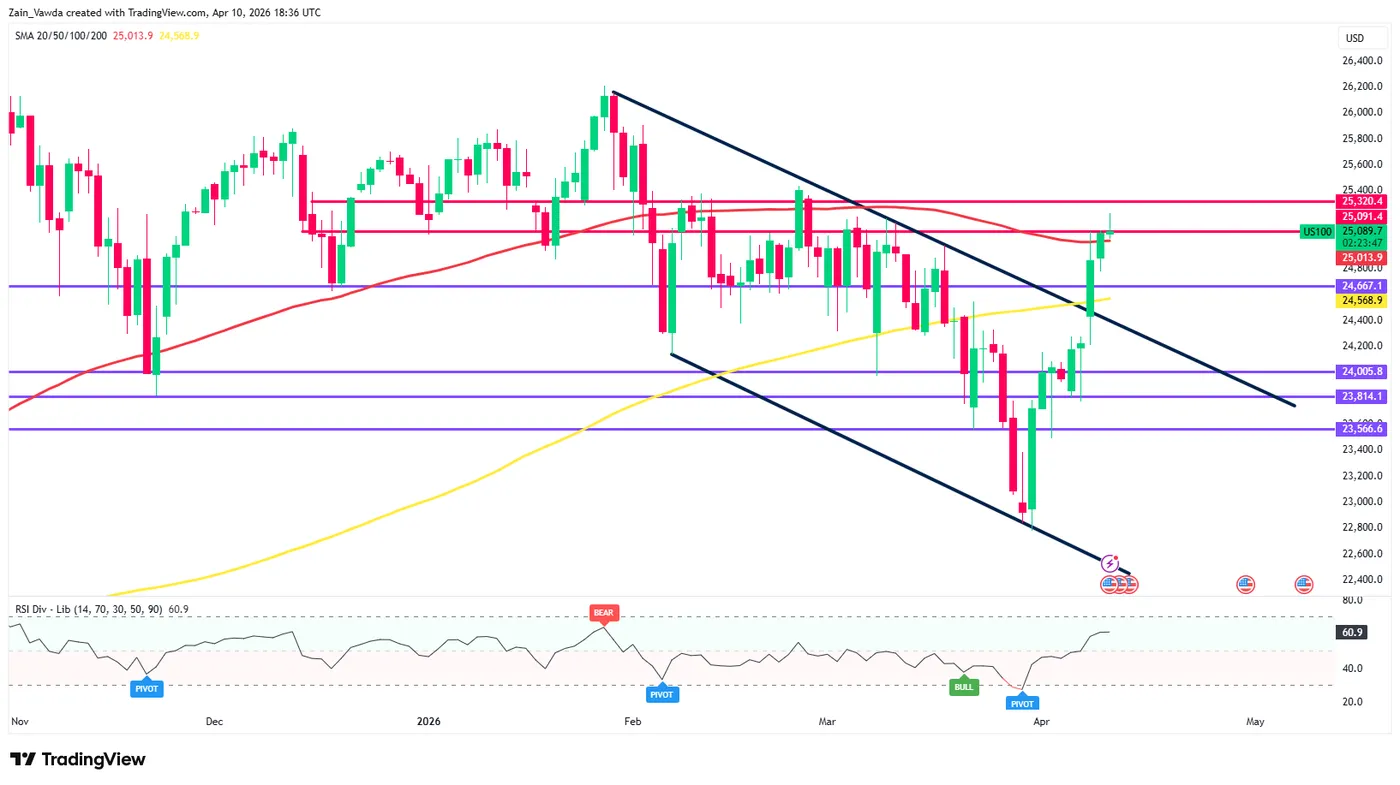
Source:TradingView.Com (click to enlarge)


