
Key takeaways
- Ceasefire optimism driving rebound: Improving prospects of a US–Iran ceasefire and reduced escalation risks have lifted sentiment, fuelling a strong recovery in the Nikkei 225 despite lingering stagflation concerns.
- Macro support from JGB yield curve steepening: Bullish steepening in Japan’s yield curve signals easing growth fears and has historically moved in tandem with equities, reinforcing the bullish outlook for the Nikkei.
- Uptrend gaining momentum near record highs: The index has rallied ~18% from late-March lows and is approaching all-time highs, with further upside likely if key support holds, while a break below support may trigger a short-term pullback.
The current US-Iran ceasefire optimism, which is now translating into a higher chance of a peace deal, has ignited the bulls in the Japanese stock market despite the ongoing blockage of the Strait of Hormuz that hinders global oil supply, which, in turn, may rouse stagflation risk.
The failure of the negotiation talks between the US and Iran over the last weekend did not lead to a further escalation of attacks by both sides, but rather some form of compromise to find a “middle ground” as the US and Iran are considering extending the earlier ceasefire deadline agreement, due on next Tuesday, 21 April, by another two weeks, and to allow make time to set up another round of negotiation talk before 21 April.
Nikkei 225 trimmed losses above the key 200-day moving average
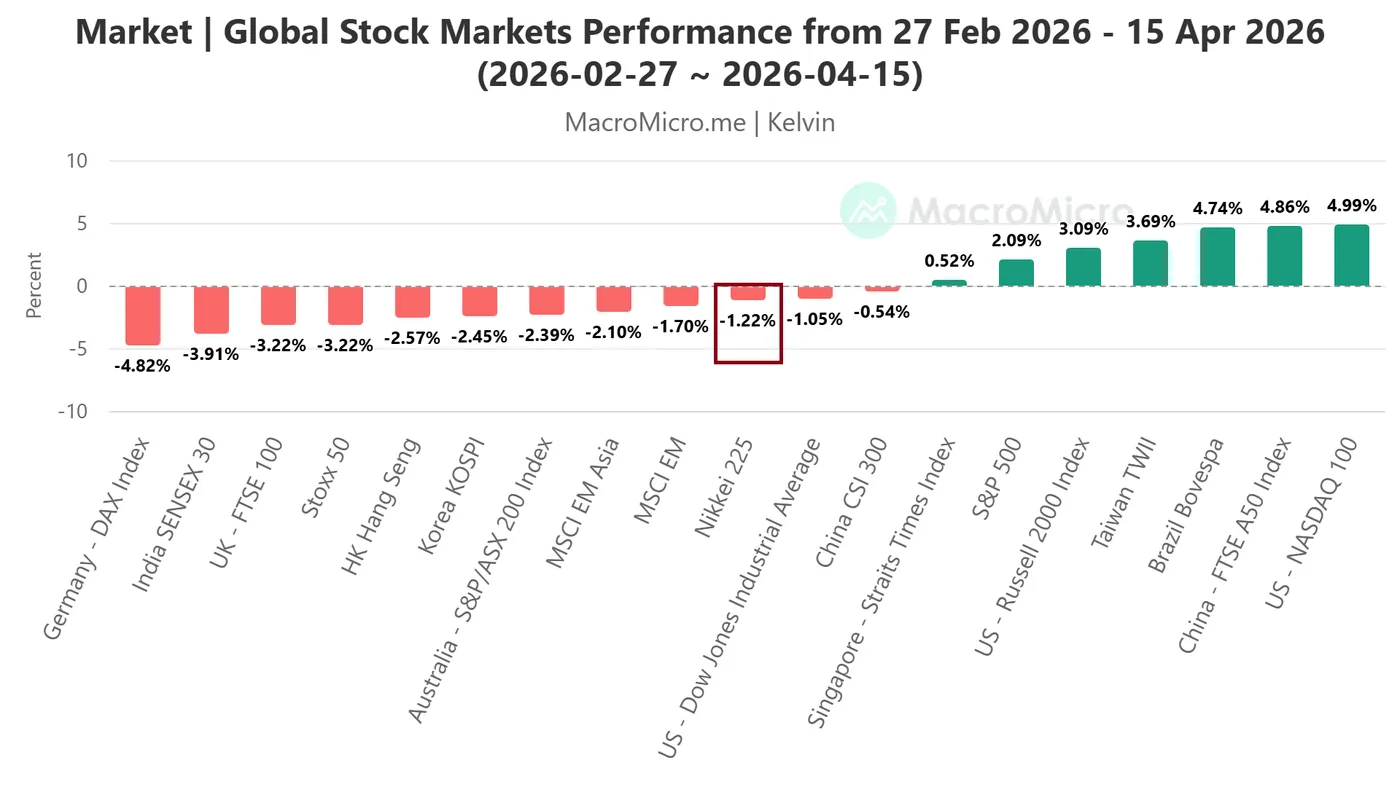
Fig. 1: Global major benchmark stock indices performances from 27 Feb 2026 to 15 Apr 2026 (Source: MacroMicro).
Since the start of the US-Iran war, the Nikkei 225 has declined by 13% from the 27 February 2026 high towards a low of 50,395 printed on 30 March 2026 while holding above its key 200-day moving average at around 48,250.
In the past five trading sessions, the losses have been trimmed, and the Nikkei 225 has now recorded a marginal loss of 1.2% measured from 27 February 2026 to 15 April 2026 (see Fig. 1).
Continuation of JGB yield curve bullish steepening has discounted stagflation fear
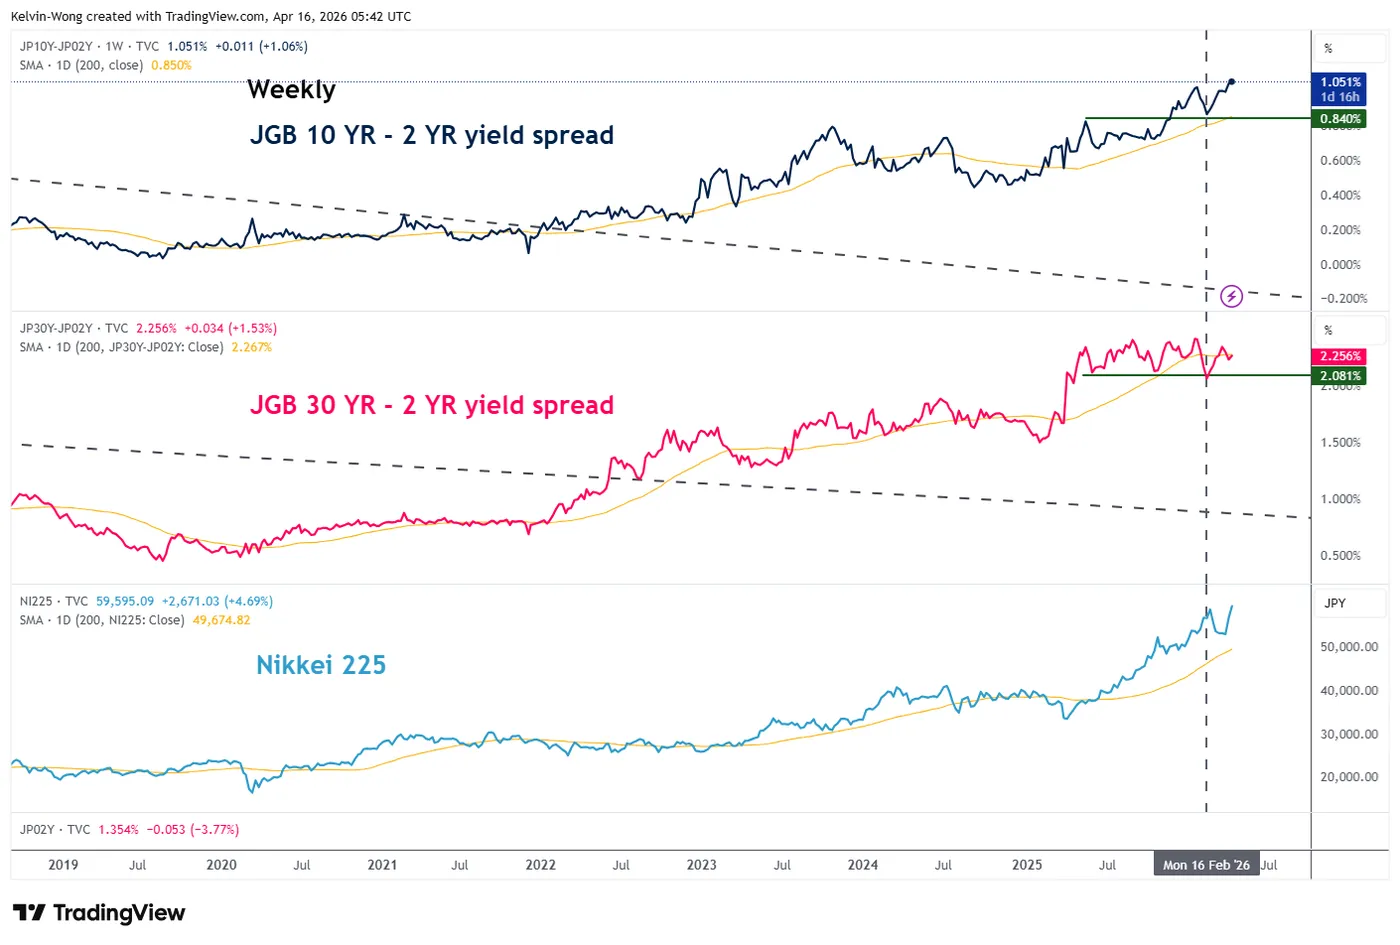
Fig. 2: JGB yield curves major trends with Nikkei 225 as of 16 Apr 2026 (Source: TradingView).
Since last Monday, 6 April 2026, the shorter-term (2-year) Japanese Government Bond (JGB) yield has declined at a faster pace (6 basis points) versus a drop of 4 bps seen the 10-year JGB yield.
Therefore, a bull steepening has occurred on the yield spread between the 10-year and 2-year JGBs that led to trade higher above its key 200-day moving average, acting as a support at 0.84%, to a 15-year high at 1.05% at this time of writing.
A further continuation of a bullish steepening seen in the JGB yield curve is likely to support a further bullish impulse up move sequence in the Nikkei 225, as both move in direct lockstep since June 2022 (see Fig. 2).
Let’s now focus on the technical factors to determine Nikkei 225’s potential short-term trajectory (1 to 3 days).
Nikkei 225 – Oscillating within a minor ascending channel
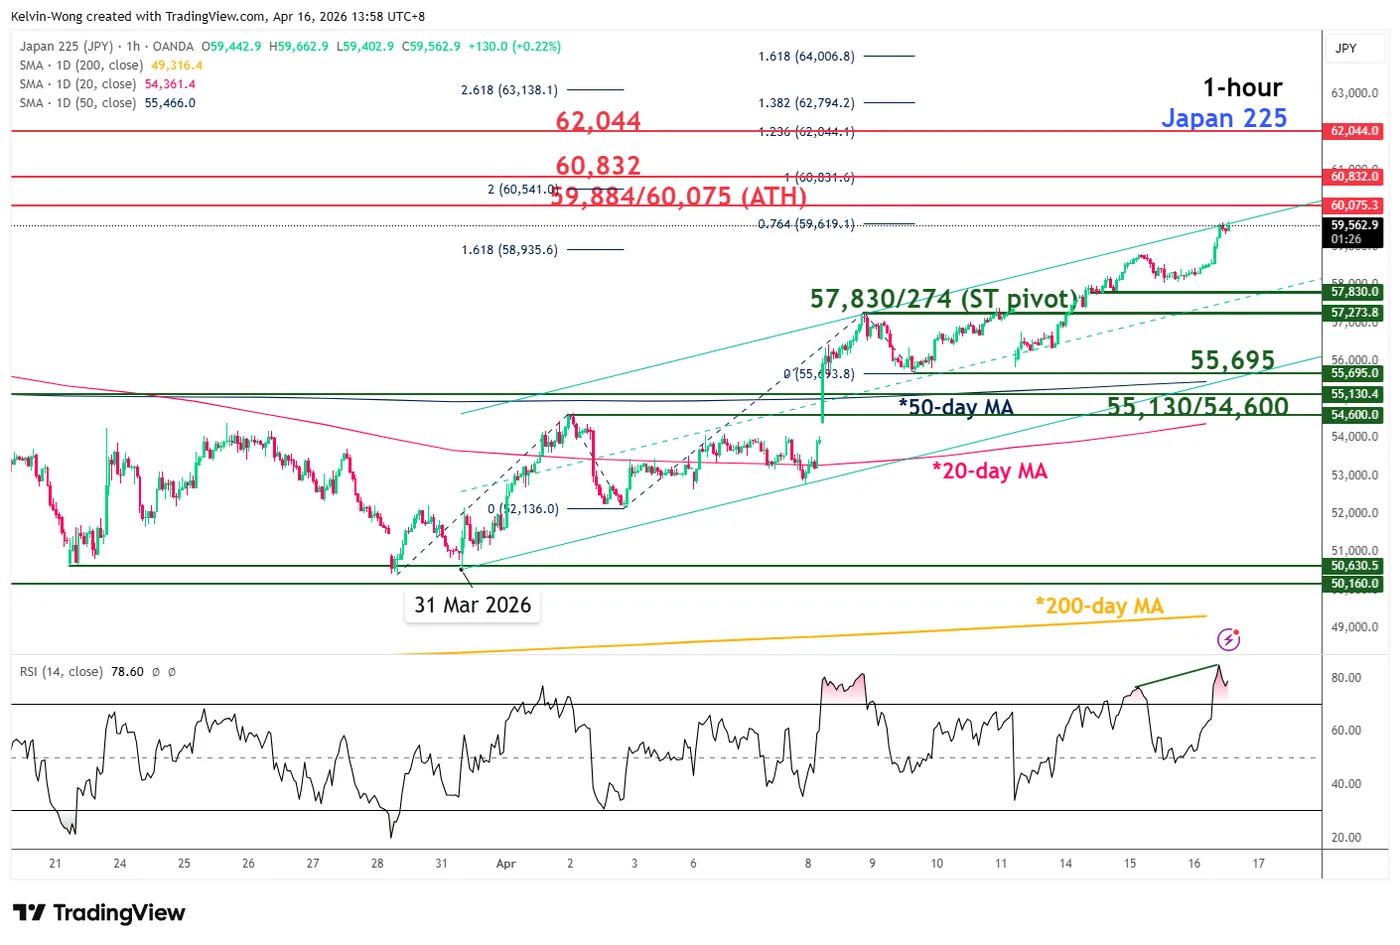
Fig. 3: Japan 225 CFD index minor trend as of 16 Apr 2026 (Source: TradingView).
The ongoing 18% rally seen from the 31 March 2026 low on the Japan 225 CFD index (a proxy of the Nikkei 225 futures) is now fast approaching an intermediate resistance of 59,890/60,075 (also the current all-time high printed on 26 February 2026).
Watch the 57,830/57,274 short-term pivotal support to maintain the bullish momentum for the next intermediate resistances to come in at 60,832 and 62,044 (Fibonacci extension clusters) in the first step (see Fig. 3).
On the other hand, a break and an hourly close below 57,274 invalidates the bullish bias for a minor corrective decline within an uptrend phase to expose the next intermediate support at 55,695 (also the 50-day moving average), and below it may see 55,130/54,600 next (also the 20-day moving average)
Key elements to support the near-term bullish bias on Nikkei 225
- Price actions are trading above the 20-day and 50-day moving averages.
- The hourly RSI momentum indicator hit an overbought reading without a bearish divergence condition.


