
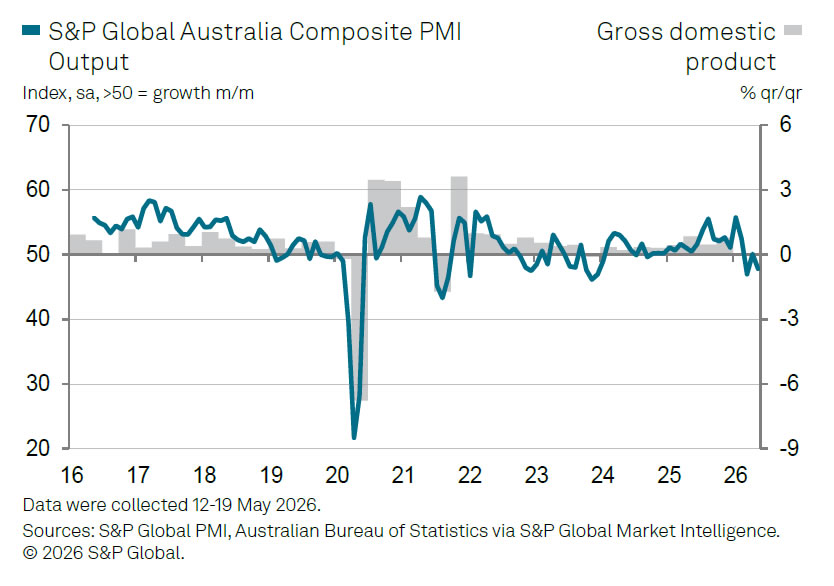
Australia’s private sector slipped back into contraction in May as weakening demand, softer employment conditions, and persistent energy-related cost pressures weighed heavily on business activity. Flash Australia Composite PMI Output Index fell from 50.4 to 47.8, marking the second contraction in three months. The downturn was led by services activity, with Flash Services PMI Business Activity Index dropping sharply from 50.7 to 47.7. Manufacturing PMI eased from 51.3 to 50.2.
The report painted a picture of an economy increasingly struggling under the prolonged fallout from the Middle East conflict and elevated energy costs. S&P Global economist Eleanor Dennison said firms continued reporting “significantly elevated price pressures often linked to raised energy costs and its knock-effects,” although inflation pressures softened somewhat from April. Manufacturers appeared particularly affected, with companies reducing stockpiling efforts as they attempted to minimize exposure to volatile input costs. Manufacturing output itself remained weak at 48.5, unchanged from April.
More concerningly, the demand backdrop deteriorated further, with businesses reporting a “faster and solid reduction in orders,” according to Dennison. That decline in demand contributed to fresh output weakness and renewed retrenchment in employment. Business confidence also deteriorated sharply, with sentiment falling to levels “only matched by that seen during the first pandemic lockdown in March 2020.”
| Indicator | Previous | Latest |
|---|---|---|
| Composite PMI Output Index | 50.4 | 47.8 |
| Services PMI Business Activity Index | 50.7 | 47.7 |
| Manufacturing PMI | 51.3 | 50.2 |
| Manufacturing PMI Output Index | 48.5 | 48.5 |


