
Fundamental Background
On 14–15 May, a high-level US–China summit took place in Beijing, where both sides discussed the potential easing of trade tensions and certain mutual concessions. Against a backdrop of positive expectations, the S&P 500 closed above 7,500 points for the first time, while the Dow Jones returned to the psychologically significant 50,000 mark.
At the same time, markets continue to feel pressure from US debt-related risks: the country’s credit rating remains below the highest tier, while the growing federal budget deficit and accumulated debt burden are increasing investors’ sensitivity to fiscal risks. The combination of trade optimism and budgetary vulnerabilities is creating a mixed and more volatile fundamental backdrop for the S&P 500.
Technical Picture
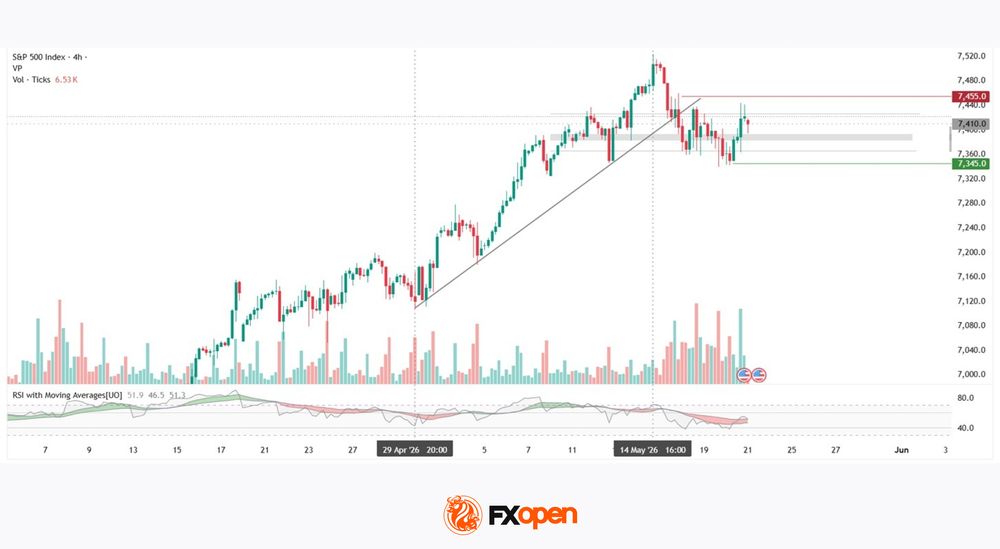
Since March 2026, the S&P 500 has remained in a medium-term uptrend, and between 29 April and 14 May it formed a new trending leg within the broader trend, reaching a peak around 7,520. The trend was subsequently broken, while trading volume increased noticeably, signalling heightened market participation. As a result of the standoff between equally matched buyers and sellers, the index has shifted into sideways movement and is currently determining its future direction.
The POC zone within the profile is concentrated around 7,385–7,390 — this is where the main area of confrontation is forming.
At present, the price remains above this zone (POC), but below the upper profile boundary at 7,425. Should the price resume its trend movement, the red resistance level at 7,455 may act as a limiting factor. The green support level at 7,345 remains a potential reference point should quotations move below the profile. RSI + MAs currently show readings of 51, 46 and 51 — the oscillator indicators remain in neutral territory, with no clearly defined directional momentum.
Key Takeaways
The index has completed its short-term bullish impulse and moved into sideways consolidation. RSI readings near neutral levels, without a pronounced directional impulse, reflect the current balance in the market — investors are weighing uncertainty surrounding trade negotiations against the backdrop of continued sensitivity to fiscal risks.
Trade global index CFDs with zero commission and tight spreads (additional fees may apply). Open your FXOpen account now or learn more about trading index CFDs with FXOpen.
This article represents the opinion of the Companies operating under the FXOpen brand only. It is not to be construed as an offer, solicitation, or recommendation with respect to products and services provided by the Companies operating under the FXOpen brand, nor is it to be considered financial advice.


