
Key takeaways
- Bitcoin plunged 16% over the past two weeks and briefly fell below the US$70,000 psychological level after MicroStrategy’s partial Bitcoin sale shattered the long-standing “never sell” narrative that had supported market sentiment.
- Despite the sharp decline, several contrarian indicators suggest selling pressure may be nearing exhaustion, including an extremely oversold daily RSI reading, a surge in long-position liquidations, and signs of renewed accumulation by long-term holders.
- Technical and on-chain metrics indicate the potential for a near-term bullish reversal above the key US$62,250 support level, with upside targets at US$74,880 and US$82,815 if buying momentum returns.
Let’s unpack the primary drivers and the technical setup.
The plunge and its fundamental catalysts
On Monday and Tuesday (1–2 June 2026), the cryptocurrency market absorbed a significant psychological blow. Spot BTC/USD tumbled sharply, slipping below the $70,000 psychological threshold and falling 16% over the past two weeks. It printed an intraday low of $65,370 on Wednesday, 3 June 2026.
The dominant driver of this week’s movement was the revelation that MicroStrategy, the world’s largest corporate holder of Bitcoin, sold a portion of its holdings for the first time in four years.
While the market impact is less about the absolute volume of the sale and more about the erosion of consensus, it effectively shattered founder Michael Saylor’s widely echoed “never sell” iron law.
This pivot disrupted the pricing anchor the market had historically relied on, injecting uncertainty and triggering a wave of defensive selling.
Technical and on-chain analysis suggesting a setup for a bullish reversal
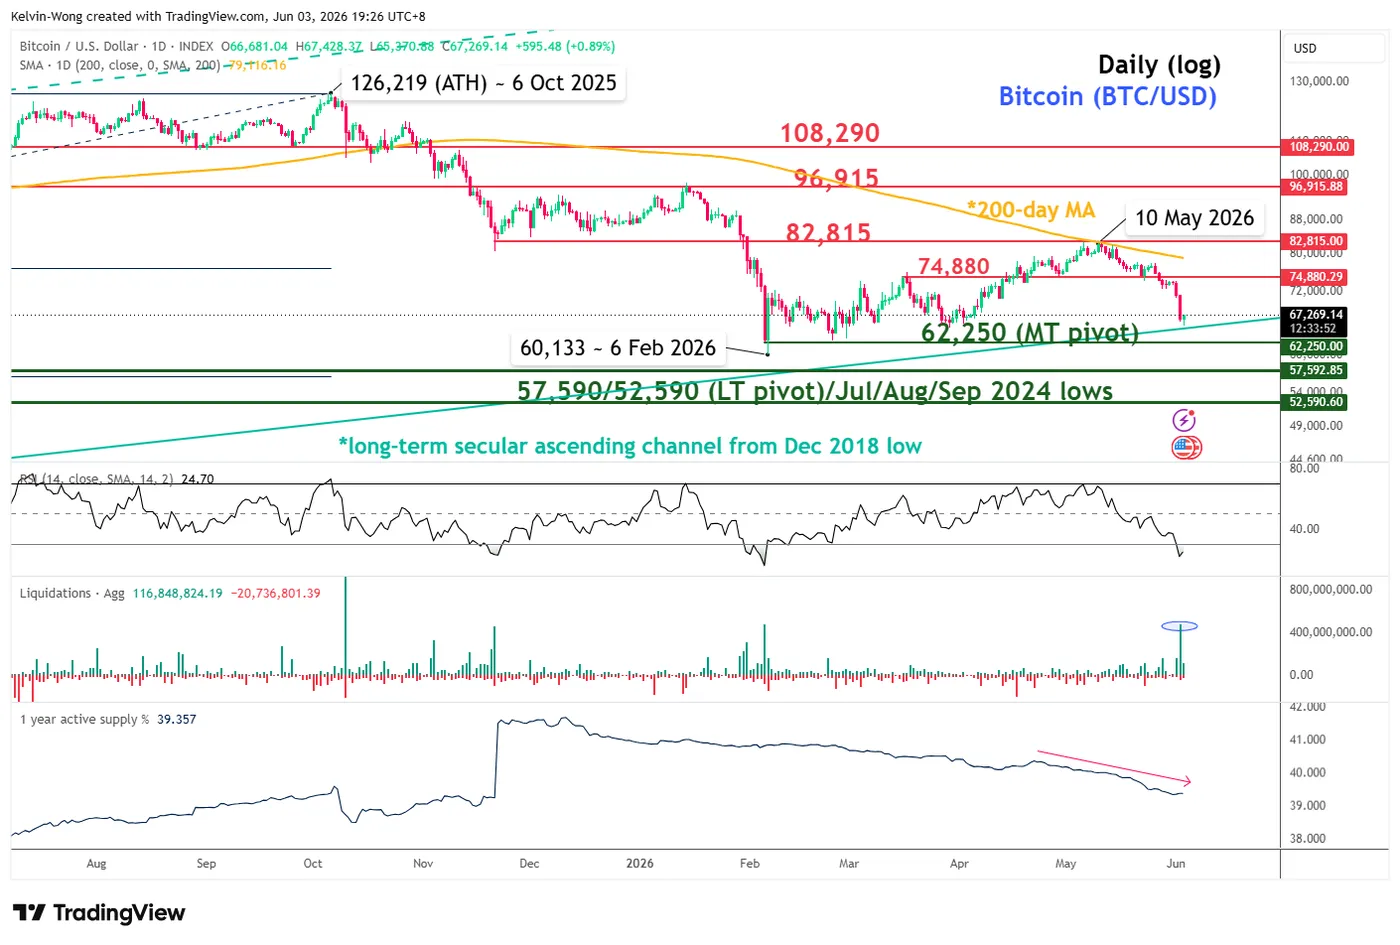
Fig. 1: Bitcoin (BTC/USD) medium-term trend as of 3 Jun 2026 (Source: TradingView). The information presented is historical information, and past performance is not indicative of future performance.
The 16% plunge in BTC/USD has left it hovering just above its $62,250 key medium-term pivotal support and the lower boundary of its long-term secular ascending channel running from the December 2018 low.
In addition, the daily RSI momentum indicator hit a significant oversold level of 21.8 on Tuesday, 2 June 2026, its lowest since 5 February 2026, triggering a 35% rally in BTC/USD over the next three months.
Secondly, utilising TradingView’s crypto derivatives indicators for crypto futures and perpetual swaps, such as from Bybit, Binance, and OKX.
Aggregated long liquidation data (derived from various exchanges) spiked to $482 million on Tuesday, 2 June 2026, indicating that many leveraged long positions in Bitcoin futures and perpetual swaps were forced closed due to margin calls.
A similar rise in long liquidations ($481 million) also occurred on 5 February 2026, when capitulation led to a 35% rally in BTC/USD.
Thirdly, on-chain indicator: the percentage of 1-year active supply for Bitcoin has declined steadily over the past three weeks, from 40.3% on 23 April 2026 to 39.3% on Wednesday, 3 June 2026, at the time of writing.
Active supply 1-year measures the total number of unique cryptocurrency units that have moved at least once over the past 1 year. This metric tracks the portion of supply that has been involved in on-chain transactions during the trailing 365-day period.
A decreasing active supply often signals accumulation by long-term holders, a bullish condition for Bitcoin in the current context.
Hence, based on these factors, BTC/USD is now ripe for a potential near-term bullish reversal above the $62,250 key medium-term support, with intermediate resistance at $74,880. A clearance above it would signal a retest of the $82,815 medium-term resistance (also close to the 200-day moving average).
On the other hand, a daily close below $62,250 invalidates the recovery scenario and extends the corrective decline towards the $57,590/52,590 long-term pivotal support zone.


