
Hello traders. In this technical article we’re going to look at the Elliott Wave charts of Bitcoin (BTCUSD) published in members area of the website. As our members know, we have been calling for the decline in BTCUSD since last year. The crypto market has continued to trade lower as expected. The main target area has not been reached yet, and we believe further downside may be seen in the coming days.
In this discussion, we will break down the Elliott Wave forecast and present the target zone.
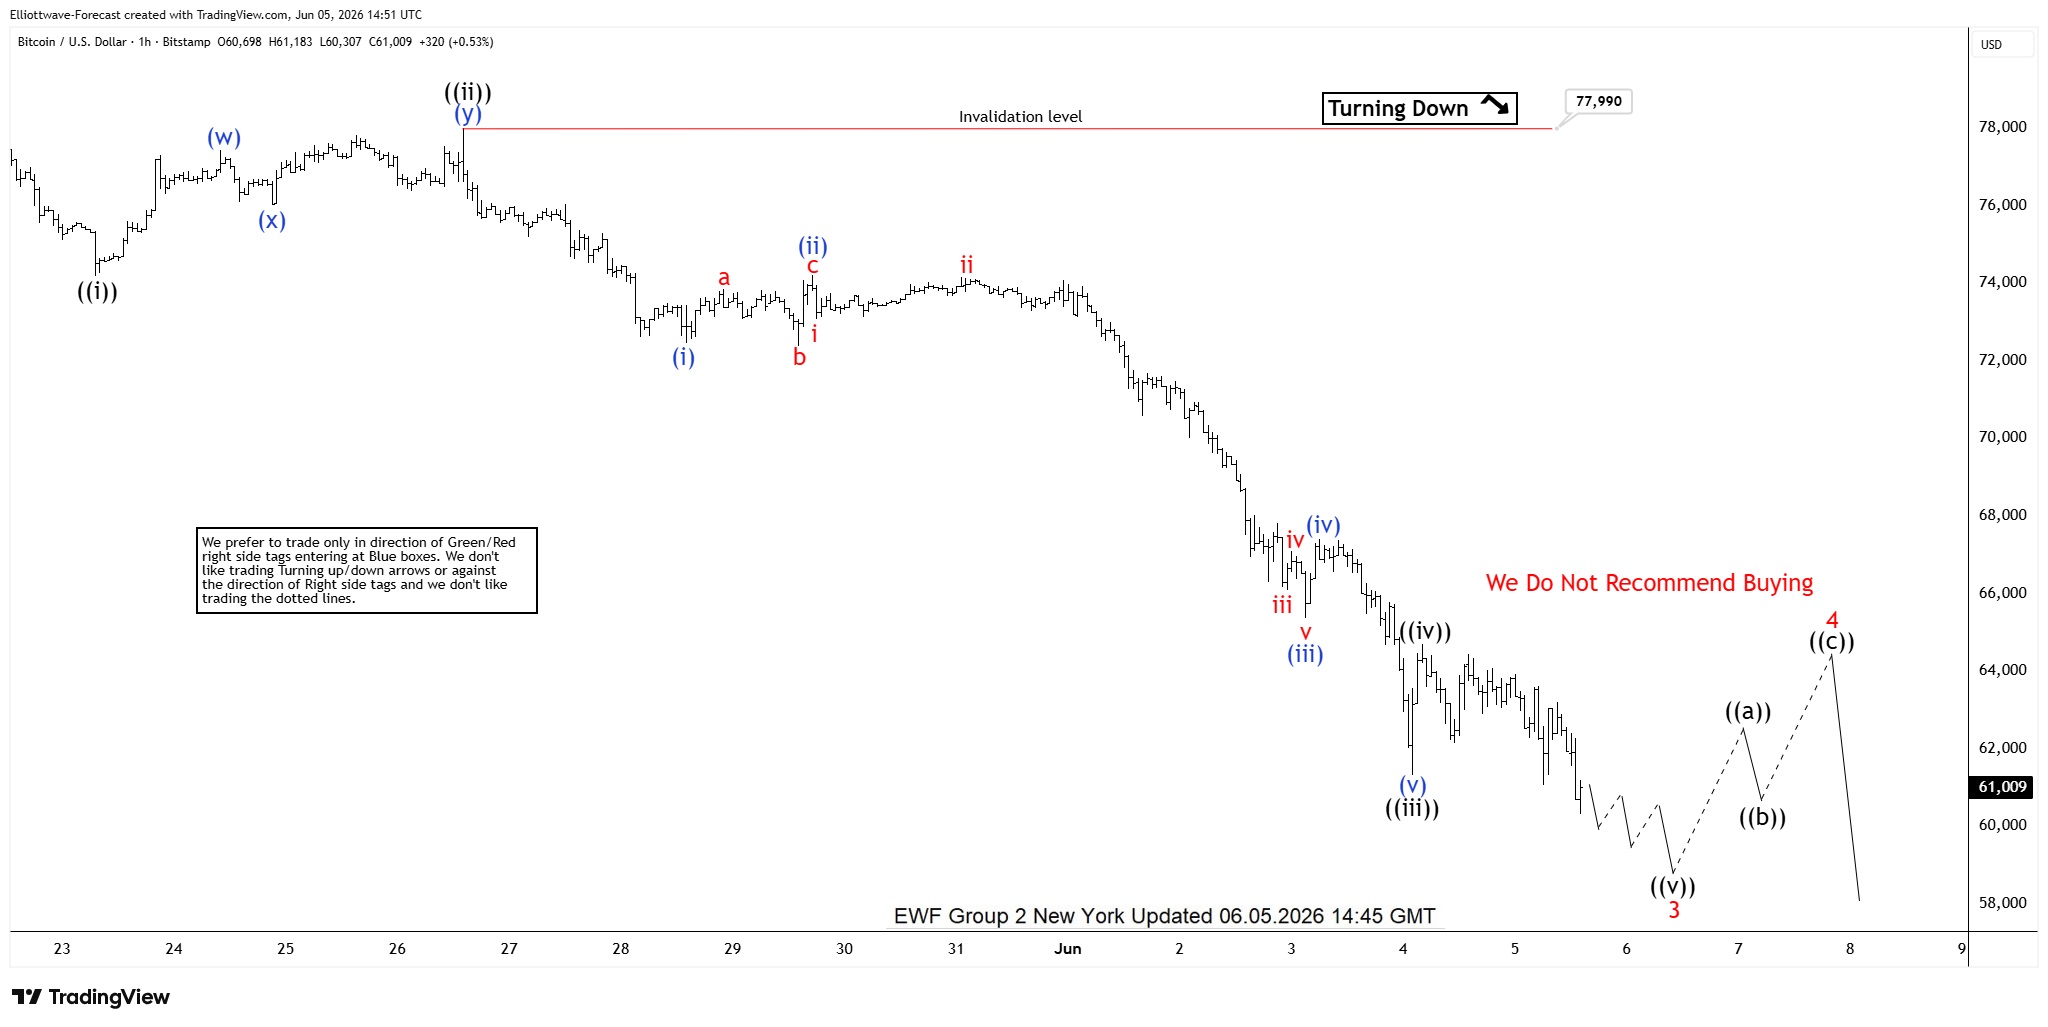
BTCUSD Elliott Wave 1 Hour Chart 06.05.2026
The current view suggests Bitcoin is developing impulsive bearish sequences, with wave ((v)) of wave 3 (red) nearing completion.
As our members know, the typical target area for wave ((v)) is projected using the 1.236–1.618 inverse Fibonacci extension of wave ((iv)). In this case, that zone comes in at 60,555–55,992. From this area, we expect a corrective three-wave bounce before the downside trend resumes.
Did you know ? 90% of traders fail because they don’t understand market patterns. Are you in the top 10%? Test yourself with this advanced Elliott Wave Test
Official trading strategy on How to trade 3, 7, or 11 swing and equal leg is explained in details in Educational Video, available for members viewing inside the membership area.
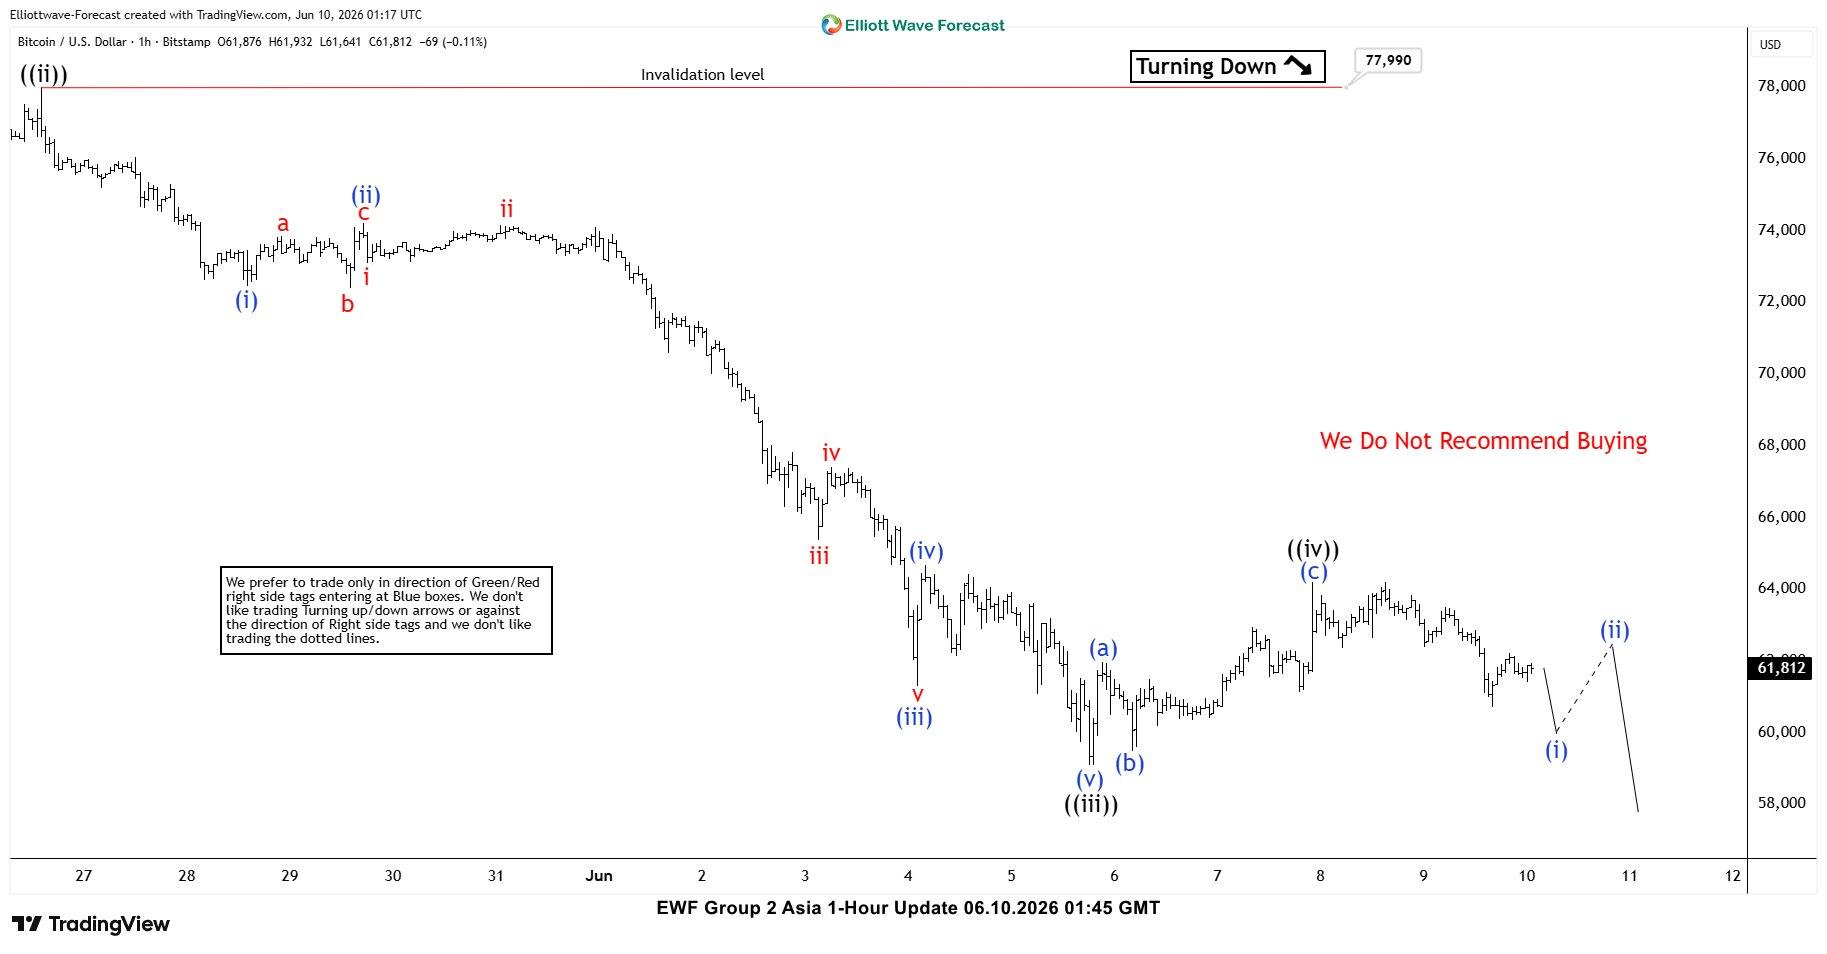
BTCUSD Elliott Wave 1 Hour Chart 06.10.2026
Bitcoin found buyers in the 60,555–55,992 area and made a three-wave bounce as expected. The overall view remains unchanged, with only a minor adjustment in wave counting.
At this stage, we consider wave ((iv)) completed at 64,200. While price remains below that high, we expect further downside within wave ((v)).
We will use the same approach to project the wave ((v)) target zone, based on the 1.236–1.618 inverse Fibonacci extension of wave ((iv)), which comes in at 58,020–56,080.
Important note: Our analysis is not based on Elliott Wave in isolation. We perform detailed higher-time-frame cycle analysis, which shows an incomplete market structure. This is one of the key drivers of price action, along with correlation analysis and broader market context.
We also teach our members in live analysis sessions how to identify incomplete bullish and bearish sequences. Even a 14-day trial, is enough to noticeably improve your trading analysis and forecasting approach.
Keep in mind that market is dynamic and presented view could have changed in the mean time. You can check most recent charts with target levels in the membership area of the site. Best instruments to trade are those having incomplete bullish or bearish swings sequences. We put them in Sequence Report and best among them are shown in the Live Trading Room


 published in members area of the website...)