
Key takeaways
- USD/JPY remains supported by a widening US-Japan yield differential. Markets are increasingly pricing a more hawkish Federal Reserve, with rising expectations of a Fed rate hike later in 2026, while the Bank of Japan appears likely to slow or pause its bond tapering programme despite an expected rate increase next week.
- The pair is approaching a key intervention zone near 160.40–160.70. Japanese authorities have already spent a record amount defending the yen earlier this year, making this area a critical level where renewed verbal or direct intervention risks may emerge.
- Technical momentum remains constructive in the near term. USD/JPY continues to trade within both a medium-term ascending wedge and a shorter-term rising channel, with momentum indicators remaining supportive of a further advance toward the 160.65, 161.14/20, and 161.60/95 resistance levels.
The US CPI shock and a hawkish Fed
The market enters today’s US CPI print, facing building macro headwinds and energy shocks stemming from the ongoing Middle East conflict. Following a complete evaporation of Fed rate-cut bets for 2026, the market is aggressively positioned for a bear-flattening yield curve environment under Fed Chair Kevin Warsh. With futures now pricing in a 61% probability of a 25-bps hike in October, an upside surprise in today’s CPI, potentially pushing inflation to multi-year highs, will solidify the higher-for-longer regime and maintain structural upward pressure on the greenback.
BoJ’s balancing act – The June rate hike vs. bond taper pause
Next week (June 15-16), the Bank of Japan is widely expected to shift its narrative toward becoming an active “inflation fighter”. Aggregated polls show nearly 94% of economists expect Governor Ueda to deliver a 25-basis-point hike, lifting the short-term policy rate to 1.00% from 0.75%, a level last seen in 1995. This hawkish tilt is directly responsive to the persistent inflationary impulses generated by the US-Iran war.
Crucially, to mitigate political friction with Prime Minister Sanae Takaichi and stabilise a volatile sovereign bond market where the 10-year Japanese Government Bond (JGB) yield has recently hit a 30-year high of 2.8%, the BoJ is leaning towards pausing or slowing its bond-purchase taper next fiscal year.
By freezing further monthly purchase reductions (potentially keeping them steady near 2.1 trillion yen), the central bank hopes to cap the blowout of debt-servicing costs before yields breach the painful 3% threshold.
The 2-year US Treasury/JGB yield spread is widening
Fig. 1: 2-YR & 10-YR US Treasuries/JGBs yield spreads as of 10 Jun 2026 (Source: TradingView). The information presented is historical information, and past performance is not indicative of future performance.
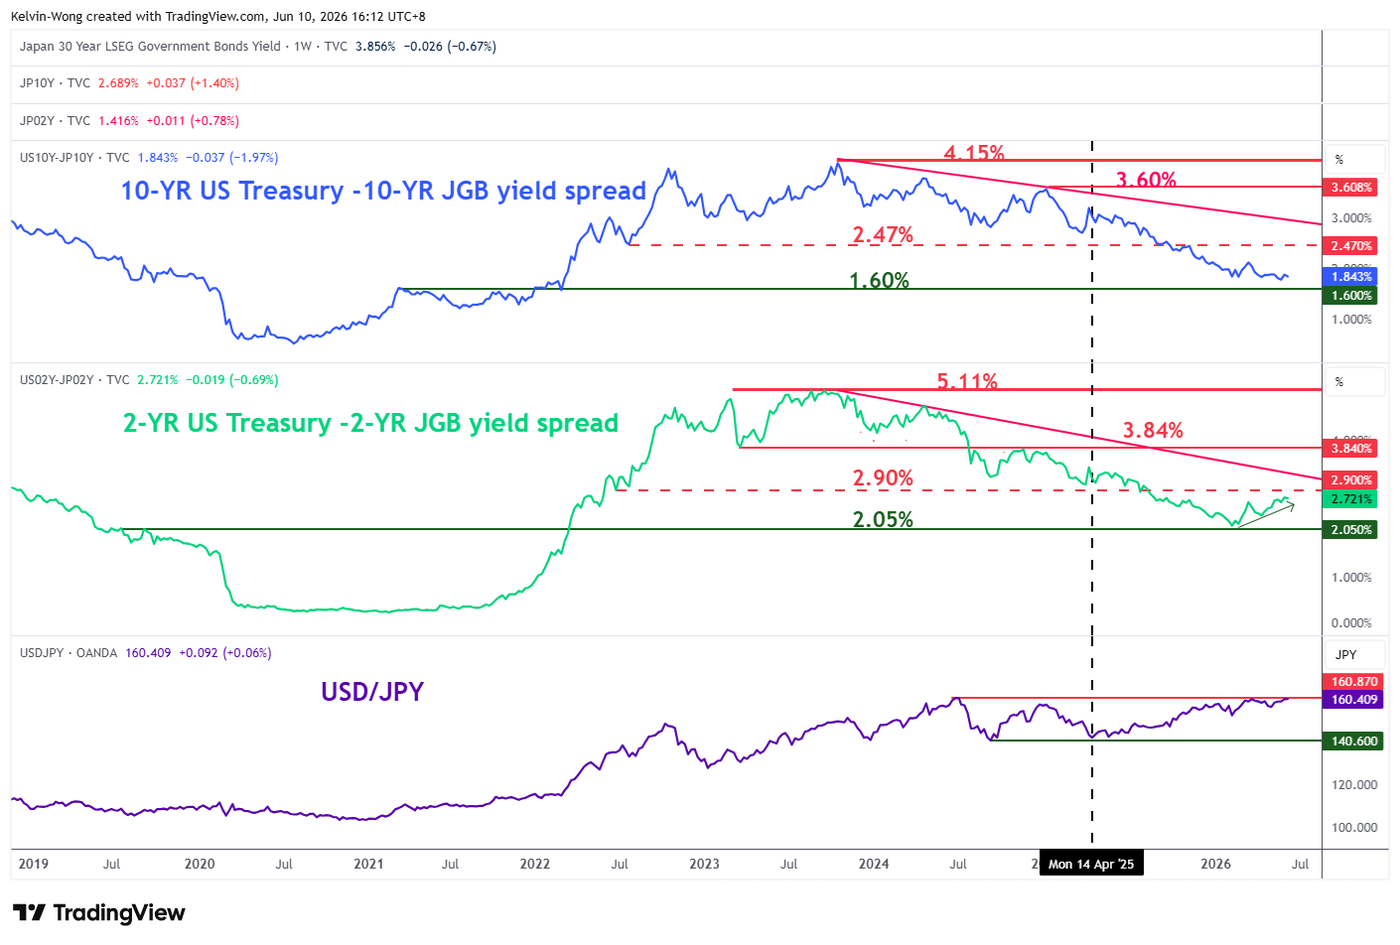
The shorter-term yield spread between the 2-year US Treasury and the Japanese Government Bond (JGB) has started to widen since hitting a 4-year low of 2.12% earlier in February 2026, which is also just a whisker above a major support of 2.05% (see Fig. 1).
The spread of the 2-year US Treasury-JGB yield has rebounded by 60 basis points to 2.72% as of Wednesday, 9 June 2026, which implies that the US Federal Reserve is adopting a more hawkish monetary policy stance over the Bank of Japan, in turn putting downside pressure on the Japanese yen as it flirts around the prior intervention area of 160.40/70, where Vice Finance Minister Mimura, in charge of foreign exchange issued a “final verbal warning” to speculators on 30 April 2026 before actual intervention took place on the same day.
Japanese authorities have spent a record $ 74.1 billion in the latest round of FX intervention to buy yen between 30 April 2026 and 6 May 2026, according to Finance Ministry data.
Let’s now unpack the short-term trajectory (1 to 3 days) of the USD/JPY from a technical analysis perspective.
Grinding up towards “Ascending Wedge” upper boundary at 160.60/95
Fig. 2: USD/JPY medium-term trend as of 10 Jun 2026 (Source: TradingView). The information presented is historical information, and past performance is not indicative of future performance.
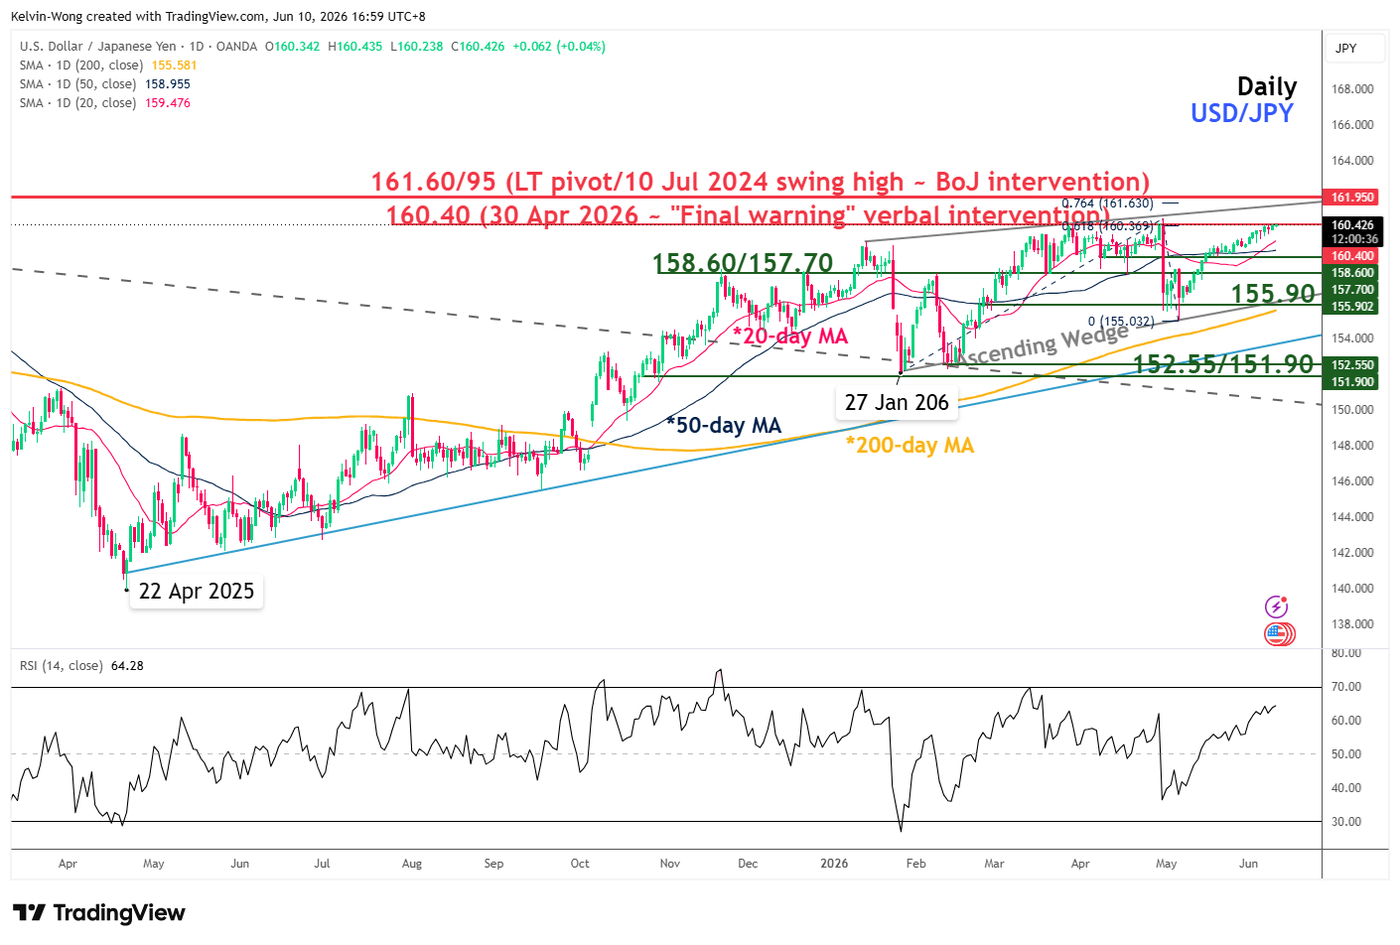
Fig. 3: USD/JPY minor trend as of 10 Jun 2026 (Source: TradingView). The information presented is historical information, and past performance is not indicative of future performance.
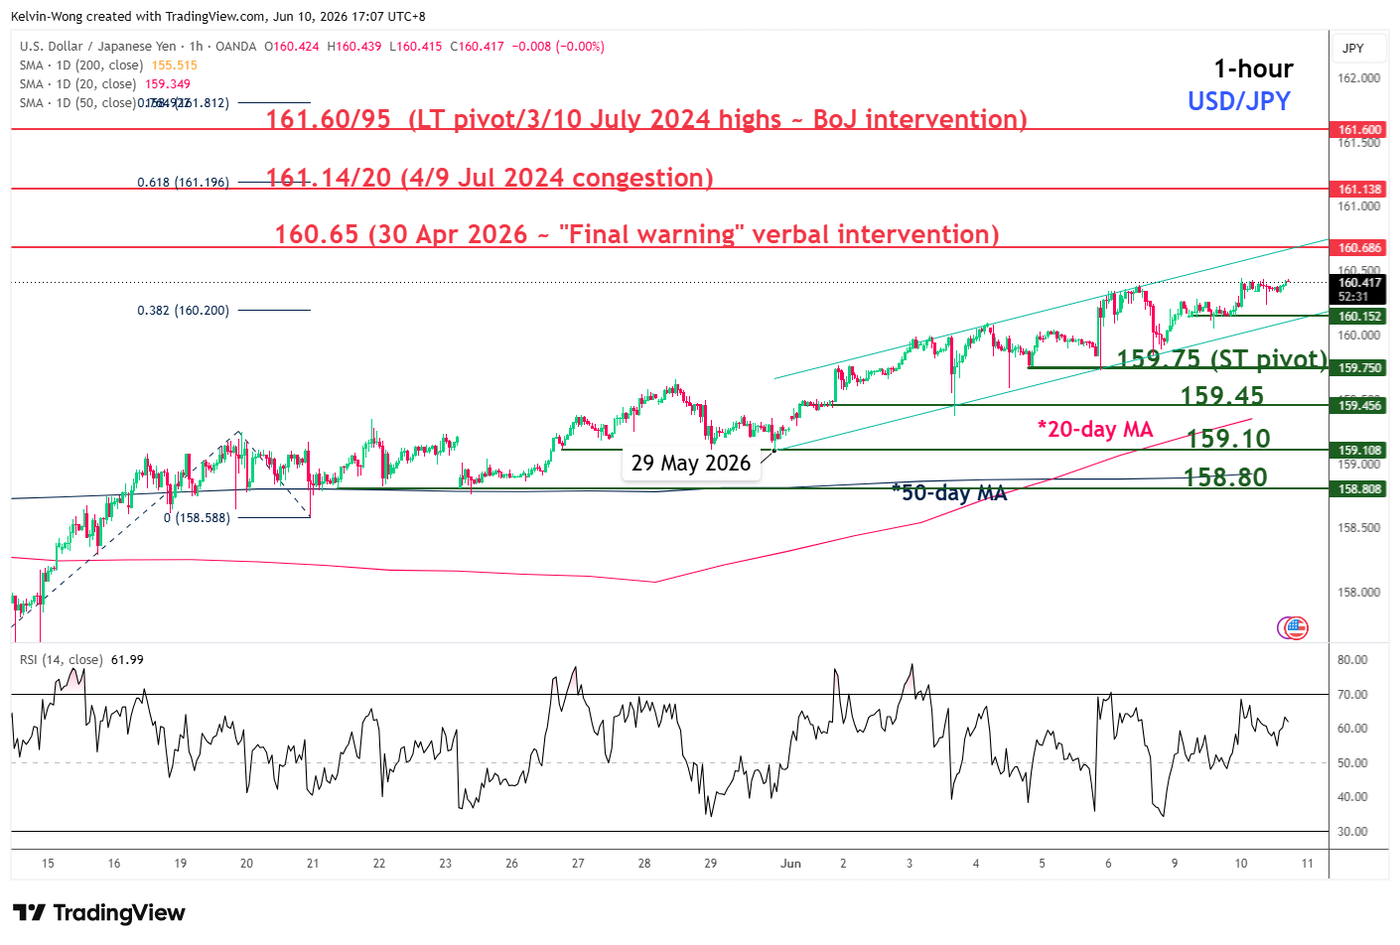
Trend bias: Minor uptrend with key short-term support pivotal at 159.75.
Resistances: 160.65 (30 Apr 2026 high), 161.14/20 (4/9 Jul 2024 congestion & Fibonacci extension), 161.60/95 (long-term pivot) (see Fig. 3).
Next supports: 159.45 (1/3 Jun 2026 congestion & 20-day MA), 159.10 (29 May 2026 low), 158.80 (21/25 May 2026 low & 50-day MA).
Key elements to support the short-term bullish bias on USD/JPY
- Price actions of the USD/JPY have been oscillating within a medium-term “Ascending Wedge” configuration since the 27 January 2026 low, with its upper boundary coming in at 161.60/95 (see Fig.2).
- The recent minor uptrend phase remains intact, as price action in USD/JPY continues to evolve within a minor ascending channel in place from the 29 May 2026 low at 159.10 (see Fig. 3).
- The hourly RSI momentum indicator remains short-term bullish, holding above the 50 level (see Fig. 3).


