
Dollar is under broad-based pressure today as safe-haven demand unwinds, but the scale of the selloff remains surprisingly modest considering the dramatic move in oil markets. Brent crude has plunged from above $95 just a day ago to below $86, one of the sharpest declines since the Iran conflict began, as investors increasingly price the possibility of a breakthrough peace agreement between the United States and Iran. Yet while oil is behaving as if a deal is nearly done, currency markets appear to be waiting for confirmation before making larger bets.
The latest optimism stems from reports that a memorandum aimed at ending the conflict could be signed as soon as Sunday, with Geneva emerging as the most likely venue. According to sources, the draft agreement would include waiving sanctions on Iranian oil exports, unfreezing billions of dollars in Iranian assets and reopening the Strait of Hormuz. Iran is also pushing for a halt to hostilities across all fronts, including Lebanon, where Israel continues to battle Hezbollah. The language of the memorandum is reportedly still being finalized, highlighting that while negotiations have advanced significantly, a signed agreement remains far from guaranteed.
The reaction across asset classes reflects that uncertainty. Oil markets have aggressively dismantled geopolitical risk premium as traders anticipate a return of Iranian supply and normalization of shipping through Hormuz. Currency markets have been more restrained. Dollar is weaker, but it continues to hold above last week’s lows against major peers. The lack of a deeper decline suggests investors are willing to price the possibility of peace but remain reluctant to abandon defensive positioning entirely until signatures are on paper.
The Canadian Dollar has emerged as the week’s biggest casualty. Falling oil prices are directly undermining one of Canada’s key sources of support. Yet even if oil had remained elevated, Loonie would still face challenges because Bank of Canada appears firmly on hold while other central banks, continue to discuss the possibility of further tightening. That leaves CAD trapped in what increasingly looks like a lose-lose scenario.
Elsewhere, Dollar is the second worst-performing currency of the week, while Aussie ranks third from the bottom despite the improvement in risk sentiment. The muted response from AUD suggests investors remain cautious about the global growth outlook and continue to reassess expectations for further RBA tightening. On the other side of the ledger, Kiwi leads gains, followed by Sterling and Euro.
Oil Collapses on Hormuz Optimism, EUR/CAD Rally May Be Just Getting Started
The market may finally be shifting from pricing war to pricing peace. Reports that a draft US-Iran agreement would reopen the Strait of Hormuz have pushed oil sharply lower and helped fuel EUR/CAD’s latest breakout. Read More.
Gold and Silver Hold Make-or-Break Zones After Trump’s Iran Pivot, but Bullish Reversal Remains a Work in Progress
Trump’s decision to cancel planned strikes against Iran sparked a powerful relief rally across global markets. Gold and Silver responded by rebounding from critical support zones around $4,000 and $60, but neither metal has confirmed bottoming yet. The next battle lies at key resistance levels that will determine whether a genuine bullish reversal is underway. Read More.
ECB’s Nagel Refuses to Rule Out July Hike as Middle East Shock Persists
Just one day after ECB’s rate hike, Bundesbank President Joachim Nagel reinforced the hawkish message. Warning that the Middle East energy shock is proving “strong and persistent,” he made clear that another rate increase in July cannot be ruled out if inflation pressures continue to spread. Read More.
UK GDP Slips -0.1% M/M in April as Services Weigh, Three-Month Growth Accelerates
The UK economy contracted modestly in April, but the broader picture remains more encouraging. While services output dragged monthly GDP into negative territory, growth accelerated to 0.7% over the latest three-month period, suggesting the economy still has momentum. Read More.
NZ BNZ PMI Falls Below 50 as Manufacturers Face Demand and Energy Pressures
New Zealand manufacturing slipped back into contraction in May as weak customer demand, rising fuel costs and Middle East uncertainty weighed on activity. While larger firms continue to perform well, smaller manufacturers are facing increasing pressure heading into winter. Read More.
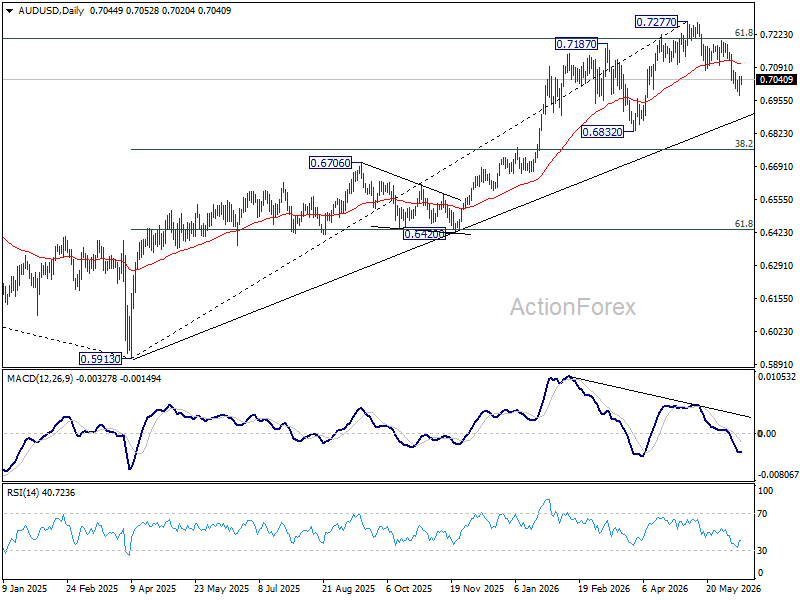
AUD/USD Daily Report
Intraday bias in AUD/USD is turned neutral with current recovery. Risk will stay on the downside as long as 0.7076 support turned resistance holds. Below 0.6977 will resume the fall from 0.7277 towards 0.6832 support next. Nevertheless, firm break of 0.7076 will argue that fall from 0.7277 might have completed, and turn bias back to the upside for stronger rebound.
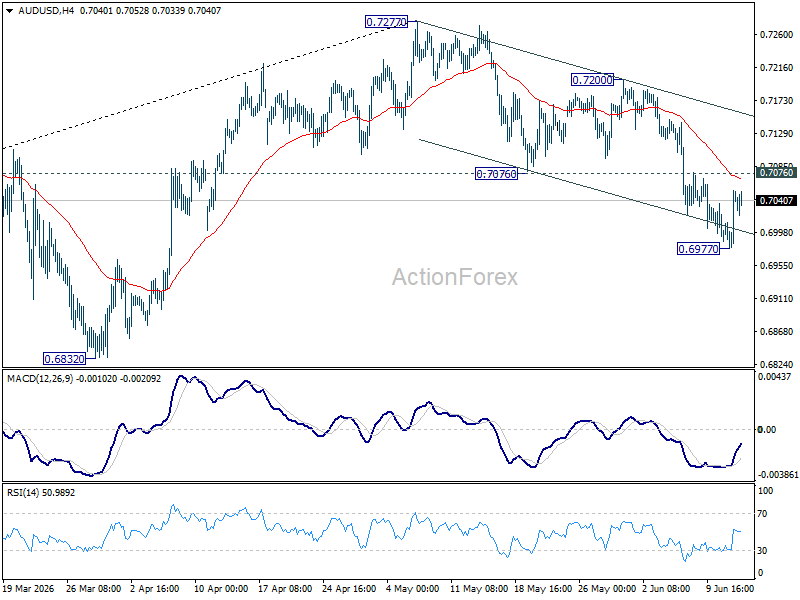
In the bigger picture, considering bearish divergence condition in D MACD, a medium term top could be formed at 0.7277 after failing to sustain above 61.8% retracement of 0.8006 (2021 high) to 0.5913 (2024 low) at 0.7206). Deeper fall could be seen to 38.2% retracement of 5913 to 0.7277 at 0.6756 as a correction. But strong support should be seen there to bring rebound. Consolidations would continue below 0.7277 for a while.


