


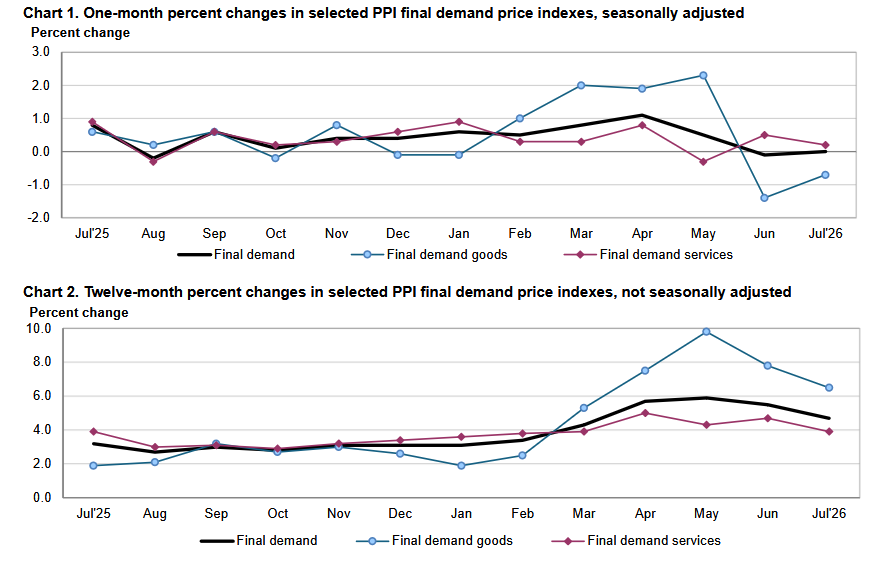
US producer inflation came in softer than expected at headline level in July, reinforcing evidence that price pressures from first oil shock are fading. PPI improved from a revised -0.1% to 0.0% m/m, below 0.2% consensus. Annual rate slowed sharply from 5.5% to 4.7%, undershooting 4.9% expected. Weakness was concentrated in goods, where prices fell -0.7% m/m, while final-demand services rose 0.2% and construction prices jumped 2.2%.
Goods breakdown was particularly soft. Energy prices fell -3.1% m/m and food declined -0.9%, while goods excluding food and energy rose just 0.1%. Services were firmer but uneven: trade services slipped -0.1% and transportation and warehousing fell -1.8%, while other services rose 0.6%. One caution came from Fed’s preferred underlying producer-price gauge excluding food, energy and trade services, which accelerated from 0.1% to 0.4% m/m, even as annual rate eased from 5.0% to 4.7%.
Overall, release strengthens case that headline pipeline inflation is cooling, but it is not an entirely dovish report. Falling energy prices did much of work at goods level, while underlying monthly measure accelerated. Combined with this week’s softer CPI, data further reduce immediate need for another Fed hike, but policymakers will be reluctant to declare victory before August figures capture latest rebound in oil prices.
Data Summary
| Indicator | Actual | Expected | Previous |
|---|---|---|---|
| PPI m/m | 0.0% | 0.2% | -0.1% |
| PPI y/y | 4.7% | 4.9% | 5.5% |
| Final Demand Goods m/m | -0.7% | — | -1.4% |
| Final Demand Services m/m | 0.2% | — | 0.5% |
| Final Demand Construction m/m | 2.2% | — | — |
| Food m/m | -0.9% | — | -0.5% |
| Energy m/m | -3.1% | — | -6.5% |
| Goods ex Food & Energy m/m | 0.1% | — | 0.2% |
| Trade Services m/m | -0.1% | — | 1.4% |
| Transportation & Warehousing m/m | -1.8% | — | -0.5% |
| Other Services m/m | 0.6% | — | 0.2% |
| PPI ex Food, Energy & Trade m/m | 0.4% | — | 0.1% |
| PPI ex Food, Energy & Trade y/y | 4.7% | — | 5.0% |
Key Takeaways
- US PPI came in softer than expected in July, moving from -0.1% to 0.0% m/m versus 0.2% expected, while annual rate slowed from 5.5% to 4.7%.
- Goods prices were main drag, falling 0.7% m/m, led by a 3.1% drop in energy and 0.9% decline in food.
- Services were firmer at 0.2% m/m, while construction prices rose 2.2%.
- Underlying picture was less dovish than headline: PPI excluding food, energy and trade services accelerated from 0.1% to 0.4% m/m, even as annual rate eased to 4.7%.
- Trade services fell 0.1% and transportation and warehousing dropped 1.8%, offsetting some strength in other services.
- Release supports case for a September Fed hold, but August PPI will be more important for judging whether renewed oil strength feeds back into broader producer costs.





