


TL;DR: Gold broke below 4,200 on Monday after taking out 4,234.68 and the 61.8% retracement at 4,230.70, turning a persistent oil-to-rates headwind into technical damage. 4,113.82 is the next momentum test, and 3,937.19–3,942.43 is the larger structural verdict.
Macro Pressure Finally Produces a Technical Break
Gold’s rate problem has moved from a persistent fundamental headwind into a more serious technical deterioration. Bullion fell nearly 2% in Asian trading on Monday, breaking below 4,200 after taking out 4,234.68 support and, more importantly, the 61.8% retracement of the 3,942.43–4,697.07 rally at 4,230.70.
That overlap matters. The 4,230 area wasn’t simply another short-term support level; it was the Fibonacci threshold holding together the argument that the rebound from July’s 3,942.43 low could still develop into something more durable. Gold has now retraced more than 61.8% of that advance. The move doesn’t yet prove the larger downtrend from 5,598.75 has resumed, but it materially weakens the bullish interpretation of the August rebound.
There’s one important timing qualification. Monday’s session is still underway. Gold has broken the support cluster intraday, but a daily close below 4,230 would provide stronger confirmation. Likewise, price is now trading below the 55-week EMA around 4,225, but a weekly close is needed before that can be treated as a confirmed higher-timeframe break. The signal is bearish; the degree of confirmation is still developing.
Iran Diplomacy Stalls, Keeping Oil Pressure Alive
The latest selling comes after another setback in US-Iran diplomacy. President Donald Trump said on Saturday that he rejected Iran’s latest proposal, which sought to link reopening the Strait of Hormuz and restarting nuclear negotiations with US concessions including easing the naval blockade and oil sanctions. US Ambassador to the United Nations Mike Waltz subsequently argued Tehran was asking for “everything up front,” including sanctions relief and access to frozen assets.
But the diplomatic channel hasn’t closed. Trump told Axios on Sunday that he expects more talks with Iran this week, while Qatari mediators continue shuttle diplomacy between the two sides. Iranian Foreign Minister Abbas Araghchi also said Tehran remained prepared for negotiations. The correct market framing is therefore an impasse rather than the death of diplomacy.
That distinction matters because Gold doesn’t need another dramatic military escalation to stay under pressure. What matters for bullion is whether diplomacy can produce enough progress to relieve the energy-price shock. It hasn’t done so yet. Brent rose around 1.6% and WTI about 1.1% in early Monday trading as doubts over a near-term US-Iran settlement returned.
The Oil-to-Rates Channel Still Dominates
For Gold, this is an extension of the mechanism that has dominated since the Iran war began in late February. Higher geopolitical tension has repeatedly transmitted first through oil, inflation expectations, and monetary-policy pricing, leaving the rates channel more important for Gold than the geopolitical headline itself.
That pressure remains intact. Markets entered Monday with roughly a two-thirds probability of another Fed hike in October after September’s quarter-point increase to 3.75–4.00%. Fed officials have also continued emphasizing that inflation pressure is no longer confined to oil.
The significance of Monday’s move is therefore not that Gold suddenly failed to respond to geopolitical risk. That pattern is already familiar. The change is that the same macro pressure has now broken a technical level that had survived the earlier phases of the selloff.
Gold had spent much of September weakening under rising Treasury yields, a firmer Dollar, and renewed Fed hike expectations without decisively destroying the structure of the 3,942.43–4,697.07 rebound. Monday’s break through 4,230 changes that. The rates story no longer merely explains why Gold is struggling to rally; it’s now beginning to reshape the chart.
ActionForex’s Technical View on Gold: 4,113 Becomes the Next Downside Test
With 4,230 giving way, attention shifts to 4,113.82, the 61.8% projection of the decline from 4,697.07 to 4,234.68, projected from the 4,399.58 rebound high.
That level is important for momentum rather than for the larger structural verdict. A firm break below 4,113.82 would suggest the decline from 4,697.07 is gaining force and would increase the risk of an extension toward the 3,937.19–3,942.43 zone. The 100% projection lies at 3,937.19, almost exactly overlapping July’s 3,942.43 low.
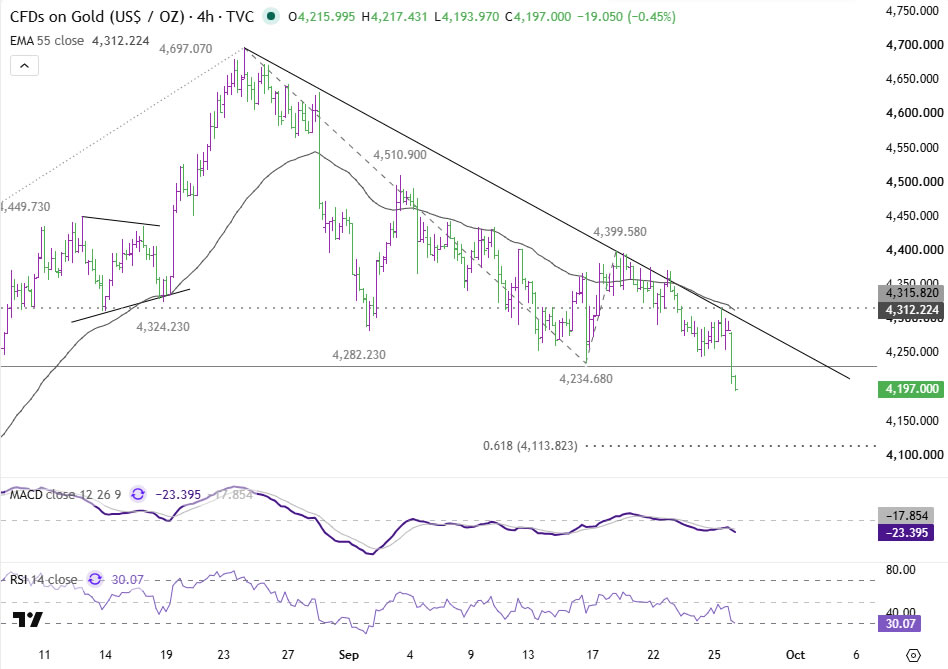
The pattern from 4,697.07 is still not clearly impulsive. It can still be interpreted as a corrective decline, potentially a zigzag. But that argument is becoming less comfortable after Gold retraced more than 61.8% of the preceding rise.
If the 3,942.43–4,697.07 advance were the beginning of a new impulsive uptrend, bulls would normally prefer to see the retracement contained before this point. Breaking deeply through the move instead raises the probability that the August rally was a B-leg or corrective rebound inside the larger decline from 5,598.75. That’s not confirmation. The confirmation test sits lower.
3,942 Is the Bigger Structural Decision Point
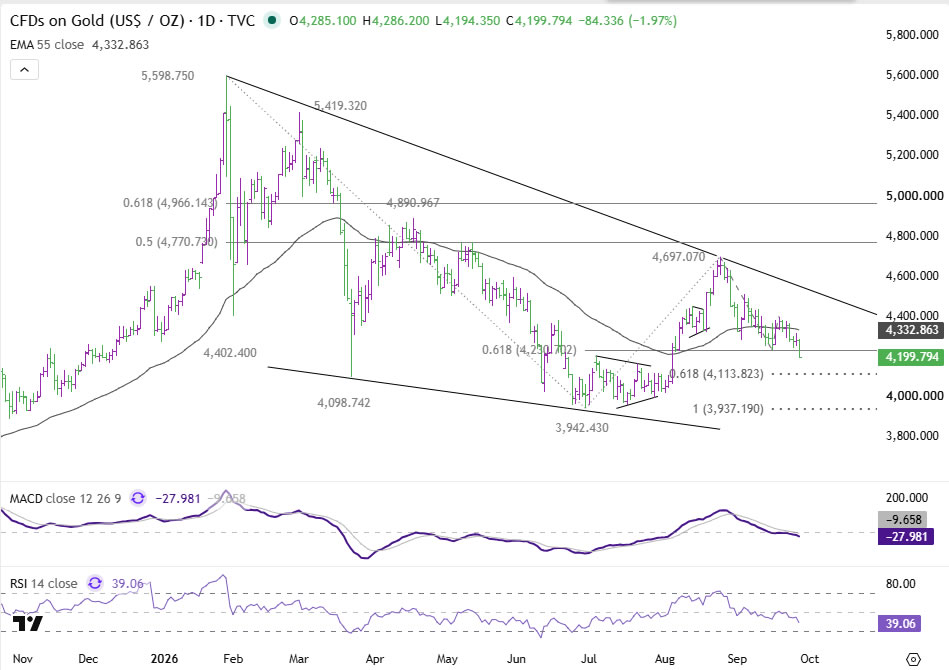
The 3,937.19–3,942.43 zone is now the more consequential level. If Gold reaches that area, holds it, and rebounds in a visibly corrective, overlapping structure that subsequently fails beneath the 4,399.58–4,402.40 region, the price action could still fit a broader corrective sequence rather than an accelerating bearish trend.
A clean and forceful break below 3,942.43, however, would change the argument materially. It would take out the origin of the entire August rebound and provide much stronger evidence that the larger decline from 5,598.75 has resumed.
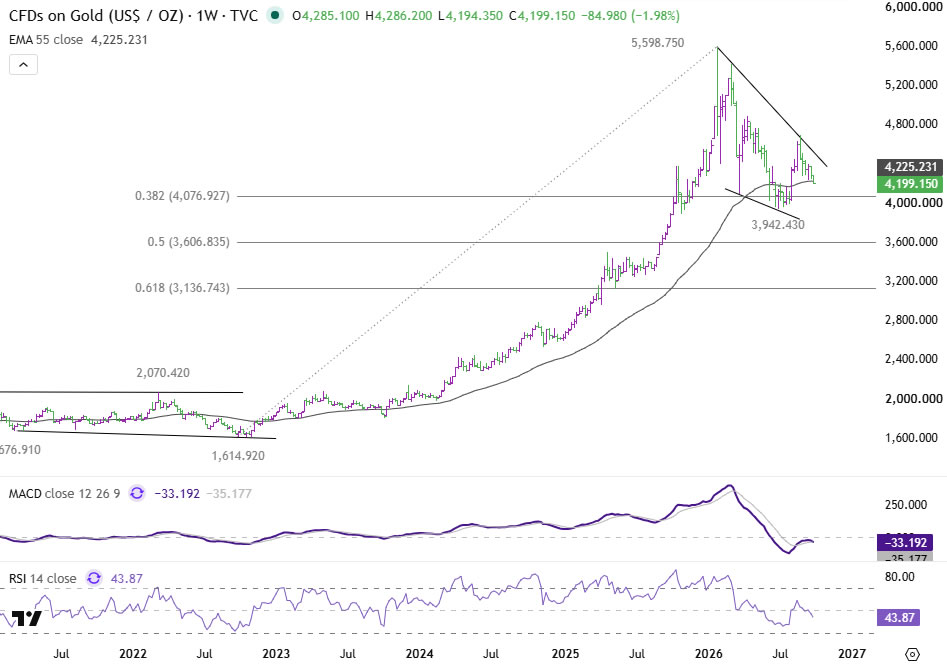
The next higher-timeframe downside reference would then be 3,606.83, the 50% retracement of the entire 1,614.92–5,598.75 advance. That remains a distant target and shouldn’t be treated as the immediate destination simply because 4,230 has broken. Gold first has to confirm through 4,113.82 and then 3,942.43.
This sequencing is important: 4,230 is the warning, 4,113 is the momentum test, and 3,942 is the larger trend test.
Bulls Need to Reclaim 4,315 First
Near term, the first level capable of challenging the bearish setup is 4,315.82. It sits almost directly alongside the four-hour 55 EMA around 4,312, making the area a useful combination of price resistance and dynamic resistance.
As long as 4,315.82 caps, near-term risk remains on the downside. The four-hour RSI has already fallen to around 30, so a rebound wouldn’t be surprising after Monday’s sharp decline. But an oversold bounce alone wouldn’t repair the structure. Gold needs to reclaim 4,315.82 before there’s meaningful evidence the breakdown is stalling rather than merely pausing.
The daily picture is also unfavorable. Gold had already failed around its 55-day EMA, now near 4,333, before Monday’s renewed selloff. The weekly chart adds another warning with price slipping below the 55-week EMA near 4,225. Neither signal alone establishes a resumed long-term downtrend, but together they increase the burden on bulls to reverse the deterioration quickly.
The Rates Story Now Has a Chart to Match It
The macro argument against Gold has been visible for weeks: persistent energy pressure, elevated inflation risk, higher Treasury yields, and renewed Fed tightening expectations. Until now, the technical damage had been less decisive. That’s what Monday has started to change.
Diplomacy with Iran is still alive, and any concrete breakthrough capable of bringing oil materially lower could weaken the rates pressure on Gold. But discussion alone is no longer enough. As long as 4,315.82 caps and the oil-to-inflation-to-rates mechanism remains intact, near-term risk stays skewed lower.
The first downside target is 4,113.82. The real verdict comes around 3,937.19–3,942.43. A defense of that area would keep the larger corrective interpretation alive. A decisive break would turn Monday’s loss of 4,230 from a warning into something much more important.
Key Takeaways
- Gold broke below 4,234.68 and the 61.8% retracement at 4,230.70, retracing more than 61.8% of the 3,942.43–4,697.07 rally and weakening the bullish reading of the August rebound.
- Confirmation is still developing: a daily close below 4,230 and a weekly close below the 55-week EMA near 4,225 are needed to treat the break as decisive.
- US-Iran talks are at an impasse, not dead, with Trump expecting more talks this week; oil rose in early Monday trading, keeping the oil-to-rates channel intact.
- 4,113.82 is the momentum test, and a firm break would raise the risk of an extension toward the 3,937.19–3,942.43 zone, the larger structural decision point.
- Bulls need to reclaim 4,315.82, near the four-hour 55 EMA around 4,312, before there’s meaningful evidence the breakdown is stalling.





