
USD/CHF dipped to 0.9812 last week but rebounded strongly since then. The development indicates short term bottoming at 0.9812. And it’s raising the chance that decline from 1.0342 is completed. More upside is expected in near term. The corrective structure of such decline points to underlying bullishness. But strong break of 1.0342 key resistance is still needed to confirm medium term momentum. Otherwise, it’s possibly just part of a larger consolidation pattern.
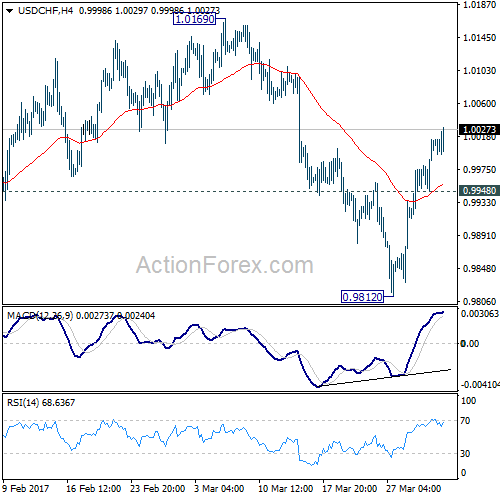
Initial bias in USD/CHF stays on the upside this week. Sustained trading above 55 day EMA (now at 1.0023) will argue that whole decline from 1.0342 has completed. Further rise should then be seen to 1.0169 resistance for confirmation. On the downside, below 0.9948 minor support will turn bias back to the downside for 0.9812 instead.
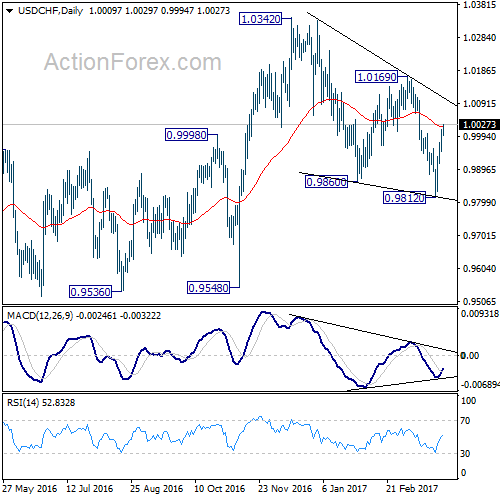
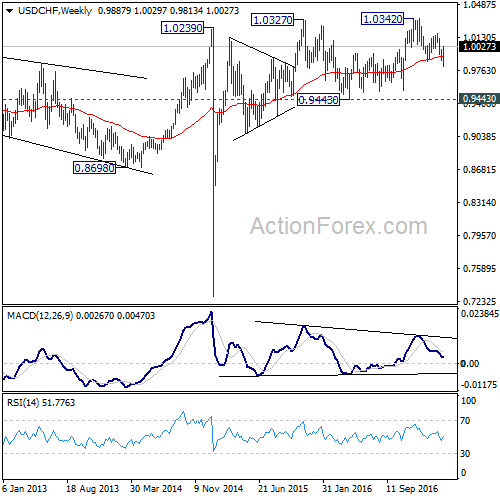
In the bigger picture, USD/CHF is staying in medium term sideway pattern between 0.9443/1.0342. In any case, decisive break of 1.0342 resistance is needed to confirm underlying strength. Otherwise, we’ll stay neutral in the pair first. In case of another fall, we’d expect strong support from 0.9443/9548 support zone.
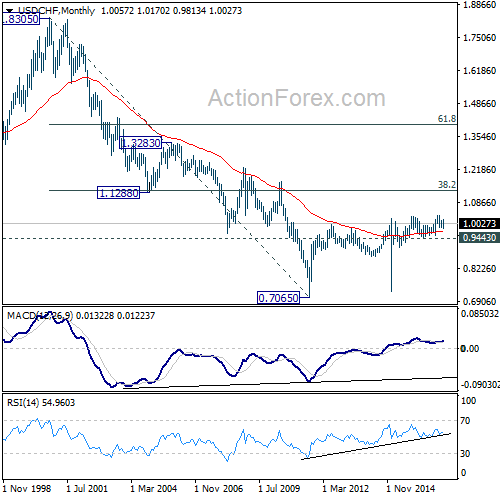
Meanwhile firm break of 1.0342 will target 38.2% retracement of 1.8305 to 0.7065 at 1.1359.


