
USD/JPY engaged in range trading in 110.10/112.19 last week and outlook is unchanged. The pair is staying well in side a near term falling channel and well below 55 day EMA (now at 112.52). More downside is mildly in favor. But the pair is also pressing 55 week EMA (now at 111.15). Hence, we’d be cautious on reversal from the current point.
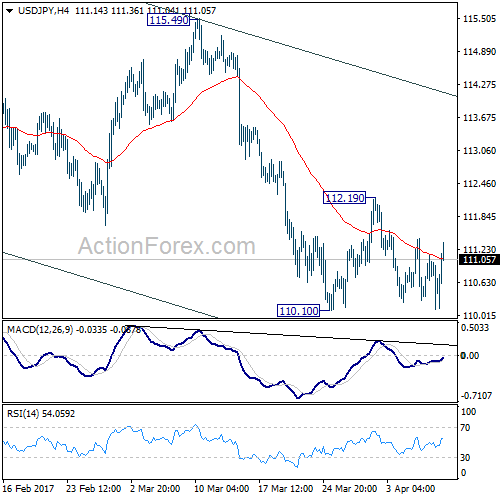
Initial bias in USD/JPY remains neutral this week first. On the downside, break of 110.10 will extend the whole decline from m 118.65 and target 50% retracement of 98.97 to 118.65 at 108.81. On the upside, however, break of 112.19 resistance will indicate short term reversal and turn bias back to the upside for 115.49 resistance.
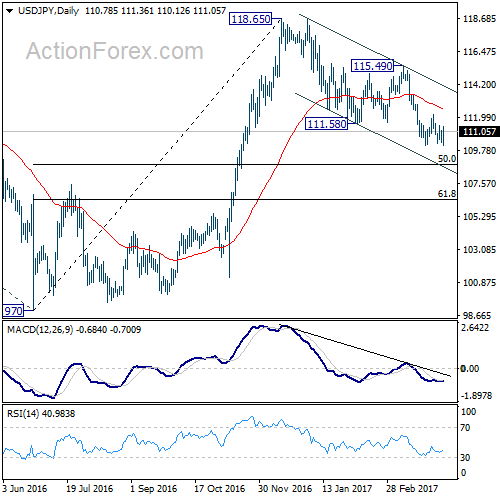
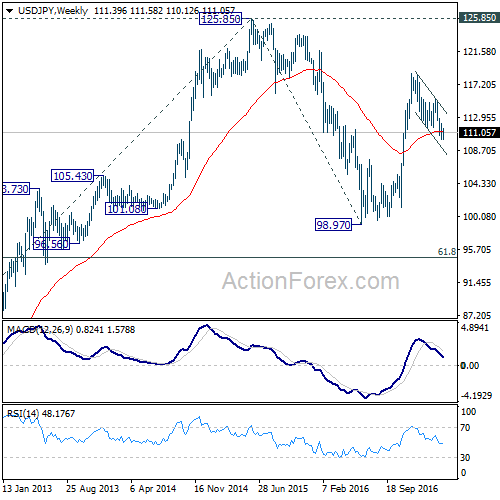
In the bigger picture, price actions from 125.85 high are seen as a corrective pattern. The impulsive structure of the rise from 98.97 suggests that the correction is completed and larger up trend is resuming. Decisive break of 125.85 will confirm and target 61.8% projection of 75.56 to 125.85 from 98.97 at 130.04 and then 135.20 long term resistance. Nonetheless, sustained trading below 55 week EMA (now at 111.15) will extend the consolidation from 125.85 with another fall through 98.97 before completion.
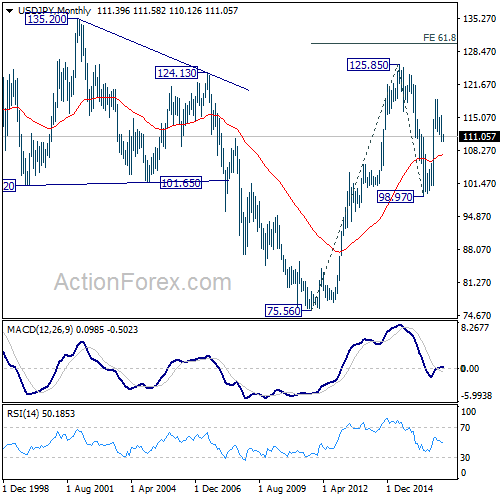
In the long term picture, the rise from 75.56 long term bottom to 125.85 medium term top is viewed as an impulsive move. Price actions from 125.85 are seen as a corrective move which could still extend. But, up trend from 75.56 is expected to resume at a later stage for above 135.20/147.68 resistance zone.


