
Dollar maintains its position as the week’s top performer so far, following notable upside breakouts, while Asian markets remain relatively quiet. Without major economic releases from US today, the greenback could have a breather first. However, attention is set to return later in the week with the release of retail sales and the University of Michigan consumer sentiment index, which could reinvigorate the Dollar’s rally.
On the other hand, Sterling is taking center stage for now. As the week’s second strongest currency at this point, the Pound showed remarkable resilience even in the face of Dollar’s strength. Investors and market analysts alike are keenly awaiting today’s UK inflation data, which could either reinforce BoE’s hesitation to lower interest rates. Any unexpected upward surprise in inflation might not only affirm the BoE’s current stance but also spur additional Sterling rally, especially in crosses.
Across the forex markets, the Swiss Franc endures as the weakest link for the week, following the sharp downturn triggered by less-than-stellar CPI figures released yesterday. New Zealand and Australian Dollars are also under pressure, dampened by mild retreat in risk appetite. Meanwhile, Euro claims the spot as the third strongest currency, while Yen and Canadian Dollar are mixed.
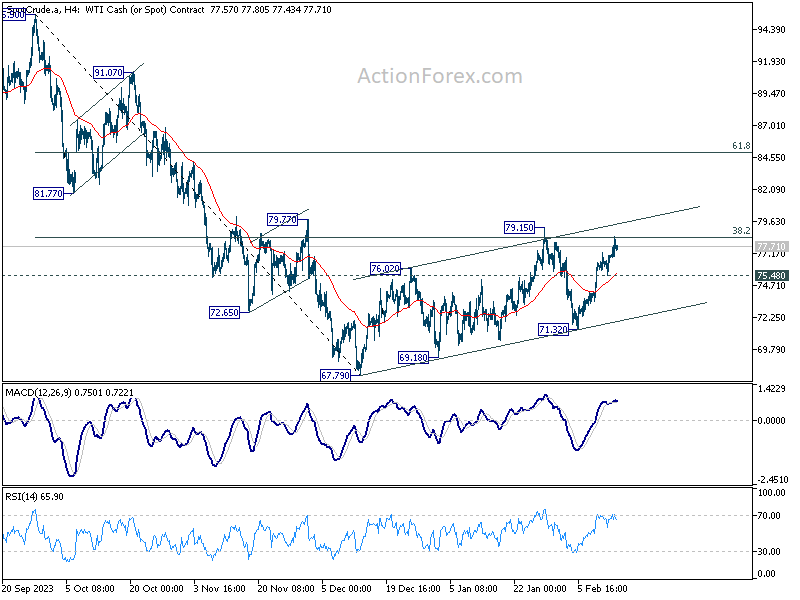
Technically, WTI crude oil is back pressing 38.2% retracement of 95.50 to 67.90 at 78.37 as the rebound from 71.32. extends this week. Strong resistance is still expected between in below 80 psychological level to limit upside. Break of 75.48 will turn bias back tot he downside for 71.32 support. However, sustained break 80 could prompt upside acceleration to 61.8% retracement at 84.91 and above. If materializes, that would be rather bad for global inflation outlook.
In Asia, at the time of writing, Nikkei is down -0.46%. Hong Kong HSI is up 0.50%. Singapore Strait times is down -0.35%. Japan 10-year JGB yield is up 0.0244 at 0.754. Overnight, DOW fell -1.35%. S&P 500 fell -1.37%. NASDAQ fell -1.80%. 10-year yield rose 0.1444 to 4.316.
DOW plunges most in nearly a year, yet outlook not gloom
DOW posted its biggest daily decline in nearly a year overnight, rattled by the latest US inflation figures that unexpectedly showcased a slowdown in disinflation. This development has cast serious doubts over Fed’s ability to start cutting interest rates cut in May, a move that was previously anticipated by investors.
The changing market expectations, now leaning towards a 65% probability of Fed maintaining rates in May, mark a stark shift from just a day prior, when the odds stood at around 40%.
The upcoming PCE inflation data, set for release on February 29, holds the potential to further cement these expectations if it mirrors the persistence in core inflation.
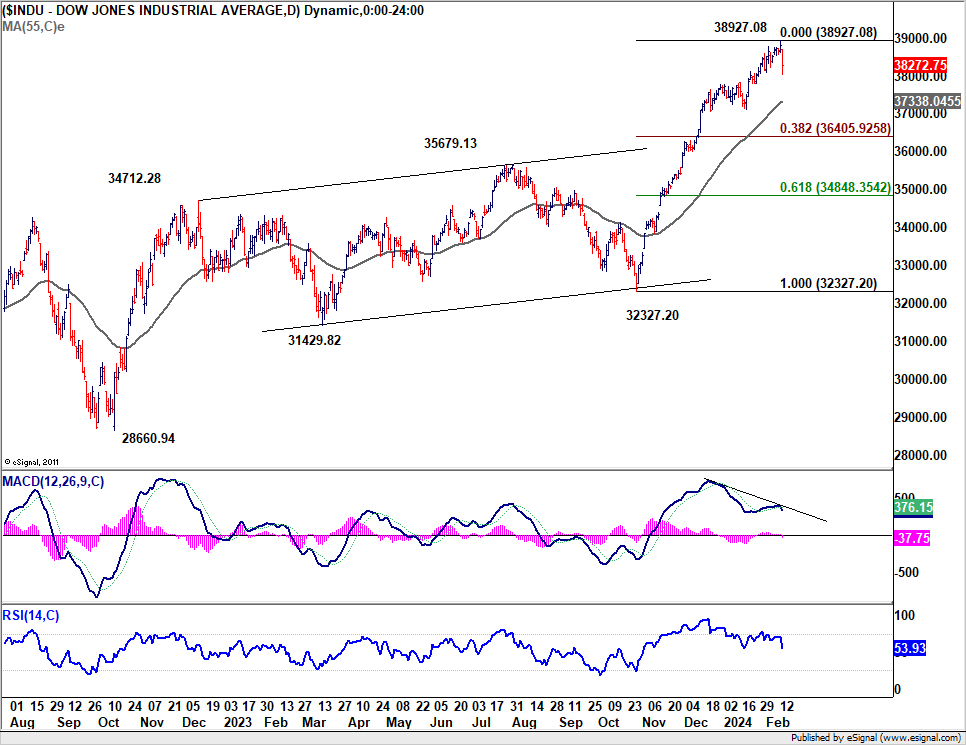
Technically, a short term top should be formed at 38927.08, but it’s not a disaster yet. Price actions from there are currently seen as developing in to a near term consolidation pattern. As long as 55 D EMA (now at 37338.04) holds, this consolidation should be relatively brief. Another rise through 38927.08 towards 40k psychological level is expected sooner rather than later.
However, considering bearish divergence condition in D MACD, firm break of 55 D EMA should trigger deeper correction to 38.2% retracement of 32327.20 to 38927.08 at 36405.92, and possibly below.
US 10-year yield breaks key near term fibonacci resistance
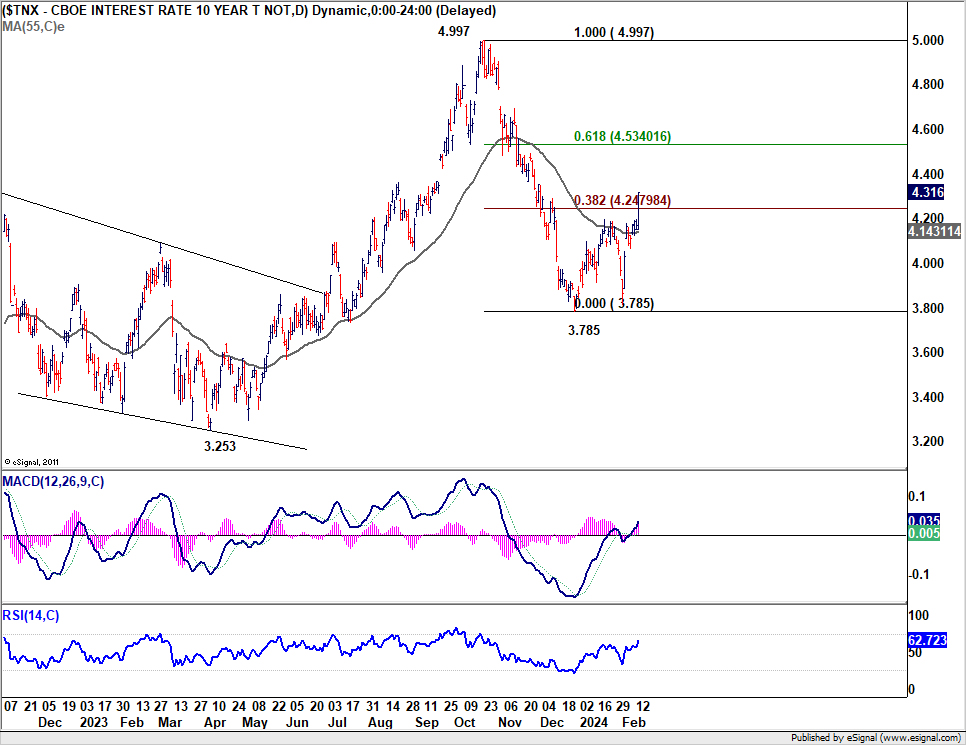
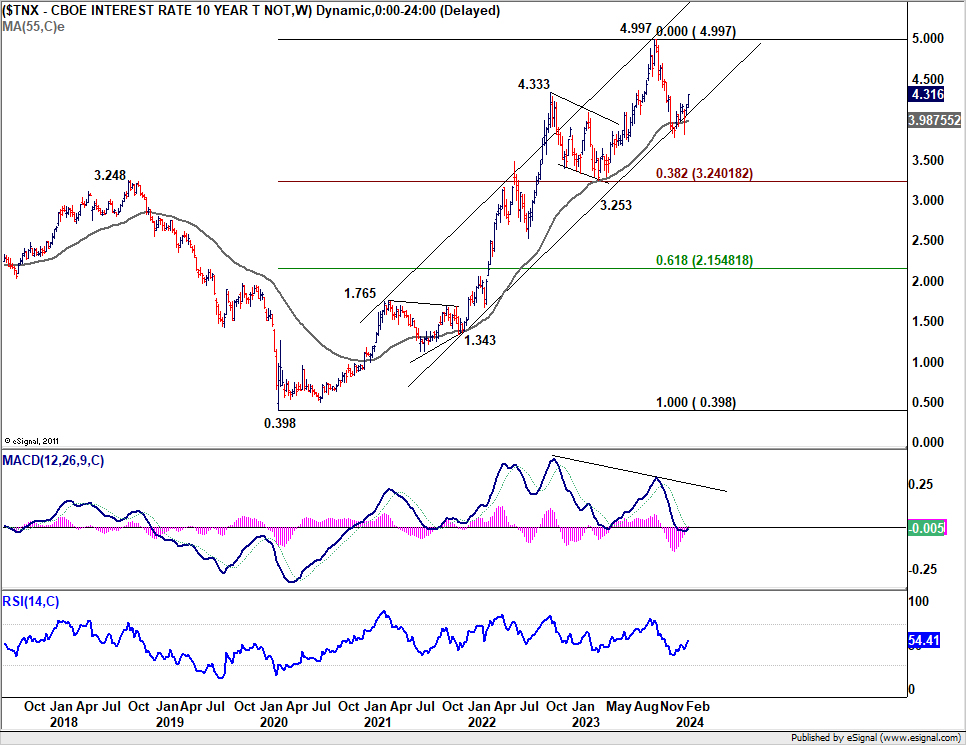
10-year yield rose 0.144 overnight to close at 4.316, breaking above 38.2% retracement of 4.997 to 3.785 at 4.247. A more important perspective is that strong support was seen from 55 W EMA and long term channel, as seen in the weekly chart. Combined, the development suggests that fall from 4.997 has completed at 3.785 already. Further rally is now expected as long as 55 D EMA (now at 4.143 holds), to 61.8% retracement at 4.534 and possibly above.
Nevertheless, there is no change in the view that price actions from 4.997 are developing into a medium term corrective pattern. Rise from 3.785 could be seen as the second leg. Upside should be capped by the 4.997 to bring the third leg down to 3.785 and below.
This technical scenario aligns with the prevailing expectation that Fed’s next move will be a rate cut. The duration and extent of the current rebound in 10-year yield will depend on when Fed decides to initiate policy relaxation. In essence, the more Fed postpones its initial rate reduction, the more prolonged and substantial the climb in 10-year yield could be. Still, this scenario would not push yield beyond 5% handle. However, decisive break of 5% would signal a significant shift in the underlying economic and monetary policy outlook and necessitate reevaluation of these expectations.
UK CPI data key to extending Sterling’s gains
Sterling has shown marked strength this week, with upcoming UK January inflation data eagerly awaited as potential catalyst for further gains. CPI is expected to edge up from 4.0% yoy to 4.1% yoy, continuing its rebound from the low of 3.9% set in November. Core CPI is also expected to rise from 5.1% yoy to 5.2% yoy.
Some analysts suggest that these projected upticks may stem largely from base effects, yet the focal point remains on the path of services inflation, which has shown a gradual increase in recent months, from December’s 6.4%, and November’s 6.3%.
Should the inflation data come in slightly above expectations, it is unlikely to shift the majority of BoE MPC towards advocating for further rate hikes alongside members like Jonathan Haskel and Catherine Mann. However, persistent stickiness in inflation, especially within the services sector, would prompt BoE to delay any rate reductions further.
The market’s reaction to this week’s robust job and wage figures has shifted expectations for BoE’s initial rate reduction to August. Today’s CPI data, coupled with tomorrow’s GDP figures, could further influence these projections.
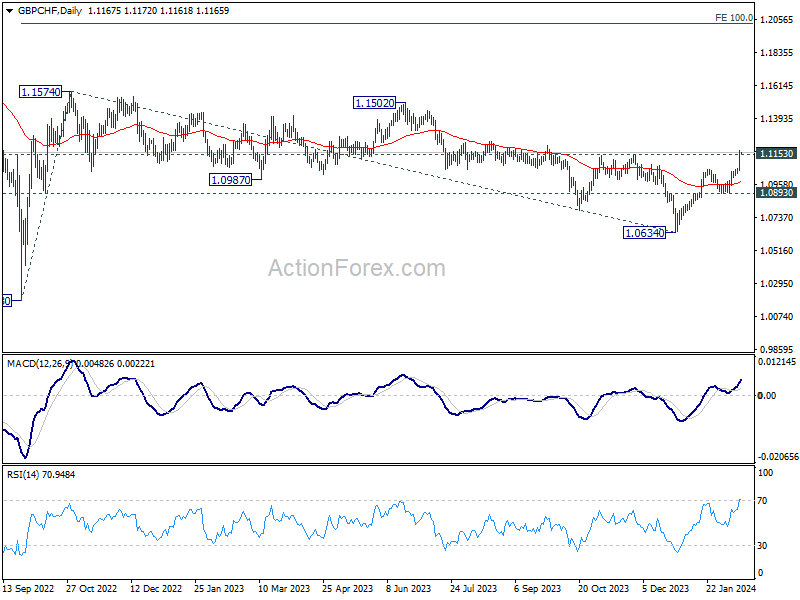
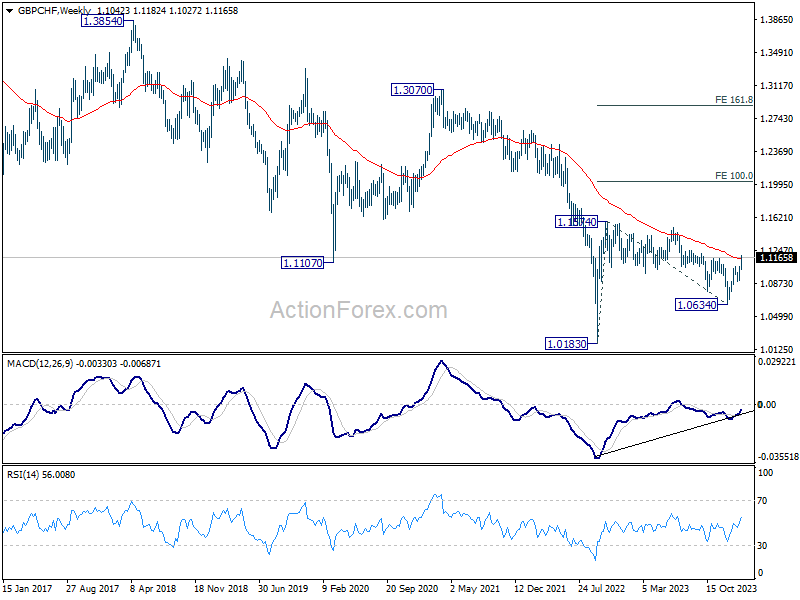
GBP/CHF’s rally accelerated higher this week. Sustained trading above 1.1153 resistance and 55 W EMA (now at 1.1149) will strengthen the case that whole correction from 1.1574 has completed with three waves down to 1.0634. Rise from 1.0634 would then develop into a medium term rally, resuming the rebound from 1.0183 (2022 low), and target 100% projection of 1.018 to 1.1574 from 1.0634 at 1.2025.
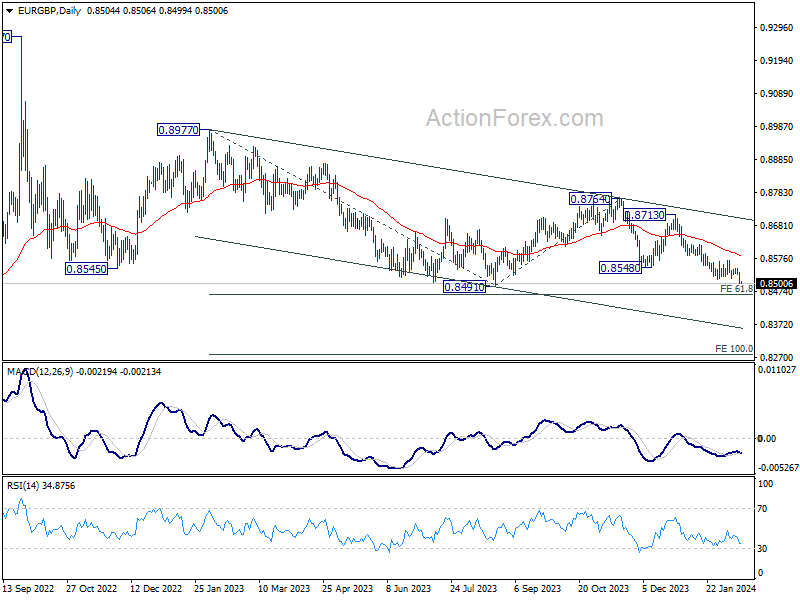
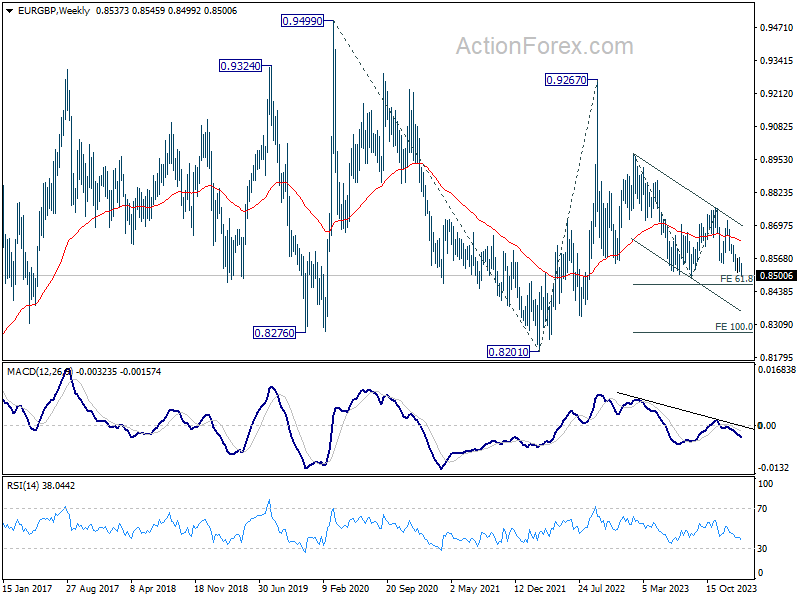
At the same time, EUR/GBP’s down trend resumed and it’s now on track to 61.8% projection of 0.8977 to 0.8491 from 0.8764 at 0.8464. Decisive break there could prompt downside acceleration, as fall from 0.9267 (2022 high) extends, and target 100% projection at 0.8278.
ECB’s Lane signals rate cut as next monetary policy move
ECB Chief Economist Philip Lane, in a discussion with Spanish RTVE, described the disinflation progress as “very good.” He added that “the next move is to cut interesting rate”.
Nevertheless, the timing of such rate adjustments would be data-dependent. Also, “the number of rate cuts we make will depend on how much progress we make towards our target,” he added.
In the background, there’s a growing consensus around the first rate cut in the current cycle, with expectations leaning towards April or June as likely windows for action.
Looking ahead
UK CPI, PPI will be released in European session. Eurozone GDP revision and industrial production will also be published. Later in the day, US crude oil inventories will be the only feature in terms of economic data.
AUD/USD Daily Report
Daily Pivots: (S1) 0.6419; (P) 0.6478; (R1) 0.6514; More…
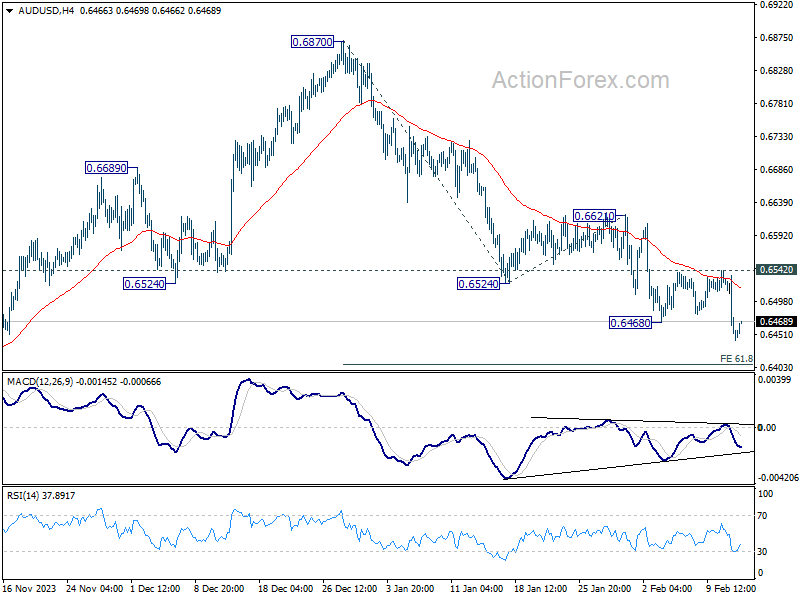
AUD/USD’s decline from 0.6870 resumed by breaking 0.6468 support. Intraday bias is back on the downside for 61.8% projection of 0.6870 to 0.6524 from 0.6621 at 0.6407. Firm break there will target 100% projection at 0.6275, which is close to 0.6269 support. On the upside, 0.6542 resistance is needed to indicate short term bottoming. Otherwise, outlook will stay bearish in case of recovery.
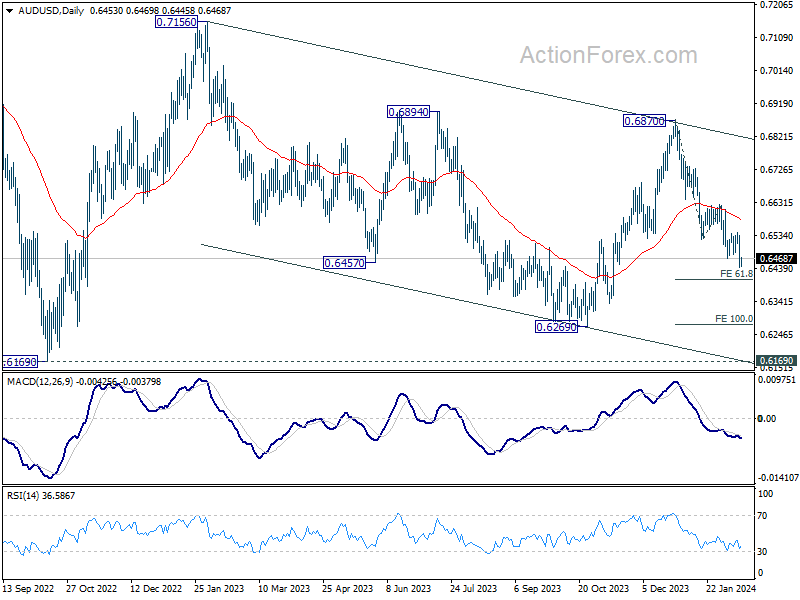
In the bigger picture, price actions from 0.6169 (2022 low) are seen as a medium term corrective pattern to the down trend from 0.8006 (2021 high). Fall from 0.7156 (2023 high) is seen as the second leg, which might still be in progress. Overall, sideway trading could continue in range of 0.6169/7156 for some more time. But as long as 0.7156 holds, an eventual downside breakout would be mildly in favor.
Economic Indicators Update
| GMT | Ccy | Events | Actual | Forecast | Previous | Revised |
|---|---|---|---|---|---|---|
| 07:00 | GBP | CPI M/M Jan | -0.30% | 0.40% | ||
| 07:00 | GBP | CPI Y/Y Jan | 4.10% | 4.00% | ||
| 07:00 | GBP | Core CPI Y/Y Jan | 5.20% | 5.10% | ||
| 07:00 | GBP | RPI M/M Jan | -0.10% | 0.50% | ||
| 07:00 | GBP | RPI Y/Y Jan | 5.20% | 5.20% | ||
| 07:00 | GBP | PPI Input M/M Jan | 0.00% | -1.20% | ||
| 07:00 | GBP | PPI Input Y/Y Jan | -3.00% | -2.80% | ||
| 07:00 | GBP | PPI Output M/M Jan | -0.20% | -0.60% | ||
| 07:00 | GBP | PPI Output Y/Y Jan | -0.50% | 0.10% | ||
| 07:00 | GBP | PPI Core Output M/M Jan | 0.00% | |||
| 07:00 | GBP | PPI Core Output Y/Y Jan | 0.10% | |||
| 10:00 | EUR | Eurozone GDP Q/Q Q4 P | 0.00% | 0.00% | ||
| 10:00 | EUR | Eurozone Employment Change Q/Q Q4 P | 0.20% | 0.20% | ||
| 10:00 | EUR | Eurozone Industrial Production M/M Dec | -0.30% | -0.30% | ||
| 15:30 | USD | Crude Oil Inventories | 3.3M | 5.5M |


