
Markets are strikingly calm despite the breakdown in Islamabad talks, not because risks are low—but because nothing has been decided yet. With the US-Iran ceasefire deadline on April 22 still more than a week away, markets are stuck in “geopolitical purgatory,” pricing uncertainty rather than a definitive outcome. A central question for traders is whether current oil prices at $100 is expensive. Or, Strait of Horumz stays closed well into the second half of the year, $100 could be remembered as a buying opportunity, the “cheap” price.
There had been hopes for progress toward a broader peace framework in Islamabad. In hindsight, the talks functioned less as a peace summit and more as a strategic census. Both sides used the 21-hour engagement to probe each other’s red lines rather than negotiate a final agreement. For Washington, the meeting provided political cover to demonstrate that diplomacy was attempted, even as the groundwork for military escalation is laid. For Tehran, it offered an opportunity to present itself as the reasonable party while testing the resolve of the US delegation. The wide gap between positions remains intact, and it is known to both parties.
Two developments following the talks have quickly reshaped the narrative.
The first is US President Donald Trump’s announcement of a naval blockade of the Strait of Hormuz. While later clarified as targeted rather than total, it marks a significant shift from negotiating access to enforcing control.
Previously, reopening the Strait was central to ceasefire discussions. The move toward blockade and mine-clearing operations signals a transition from diplomacy to enforcement, raising the risk of direct naval skirmishes that could quickly unravel the fragile truce.
The second key shift is in rhetoric around energy prices. Trump’s Fox News admission that oil and gasoline prices may remain elevated through November’s midterm elections suggests expectations for a prolonged period of tension. This contrasts sharply with earlier claims that price spikes would be temporary.
This change matters for markets. If the Strait reopens quickly, oil near $100 may prove expensive. But if disruptions persist into the second half of the year, current levels could be remembered as relatively cheap, with the war premium becoming a structural feature rather than a temporary spike.
That April 22 deadline is the key inflection point. Once it passes, the rules of engagement shift, and the market will be forced to reprice either toward sustained escalation or renewed de-escalation. Until then, oil, equities, and currencies are likely to remain trapped in this uneasy equilibrium, with volatility suppressed but risks building beneath the surface.
In the currency markets, Loonie is currently the strongest one for the day, followed by Dollar, and then Swiss Franc. Aussie is the weakest, followed by Yen, and then Euro. Kiwi and Sterling are positioning in the middle of the pack.
In Europe, at the time of writing, FTSE is down -0.44%. DAX is down -1.13%. CAC is down -0.90%. UK 10-year yield is up 0.038 at 4.812. Germany 10-year yield is up 0.021 at 3.082. Earlier in Asia, Nikkei fell -0.74%. Hong Kong HSI fell -0.90%. China Shanghai SSE rose 0.06%. Singapore Strait Times fell -0.91%. Japan 10-year JGB yield rose 0.032 to 2.474.
Gold Momentum Fades Despite Dollar Weakness, $5,000 Rejection in the Making?
Gold fails to break higher despite favorable conditions, with fading momentum near $5,000 signaling a possible rejection as markets hesitate to chase the rally. Read More.
BoJ Ueda Cites Dual Impact of Oil Prices, Keeps Markets Guessing on Next Rate Hike
BoJ Governor Kazuo Ueda warns that rising oil prices could either weaken growth or push inflation higher, underscoring a complex policy outlook. With no clear signal ahead of the April meeting, markets are left guessing on the next move as geopolitical risks cloud the outlook. Read more
New Zealand PSI Drops to 46.0, BNZ Sees Economy Nearing Contraction
New Zealand’s services sector weakened further in March, with PSI falling to 46.0 and all key components remaining in contraction. BNZ now warns the economy could be nearing contraction, prompting a downgrade to its 2026 growth outlook. Read more.
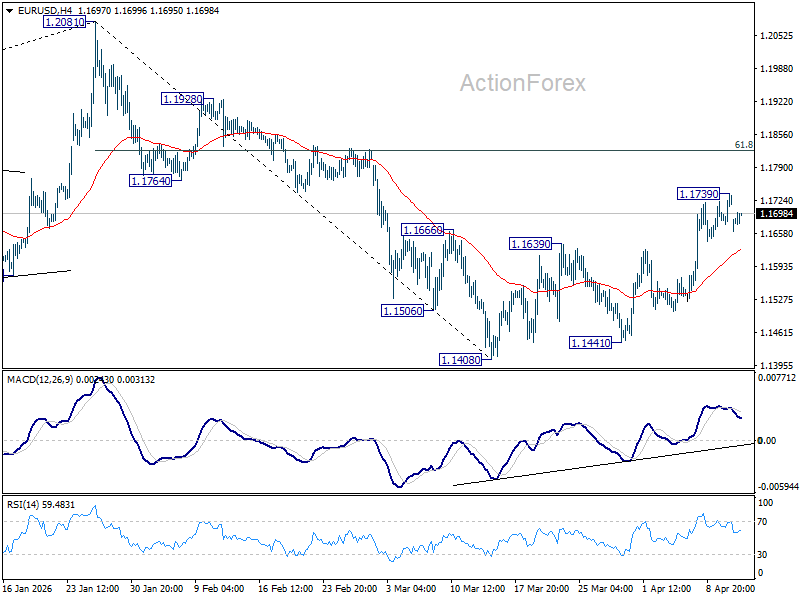
EUR/USD Mid-Day Outlook
Daily Pivots: (S1) 1.1689; (P) 1.1714; (R1) 1.1751; More….
Intraday bias in EUR/USD remains neutral and more consolidations could be seen below 1.1739 temporary top. On the upside, above 1.1739 will target 61.8% retracement of 1.2081 to 1.1408 at 1.1824. Decisive break there will pave the way to retest 1.2081 high. Nevertheless, sustained break of 55 4H EMA (now at 1.1627) will argue that rebound from 1.1408 has completed as a corrective move, and bring retest of this low.
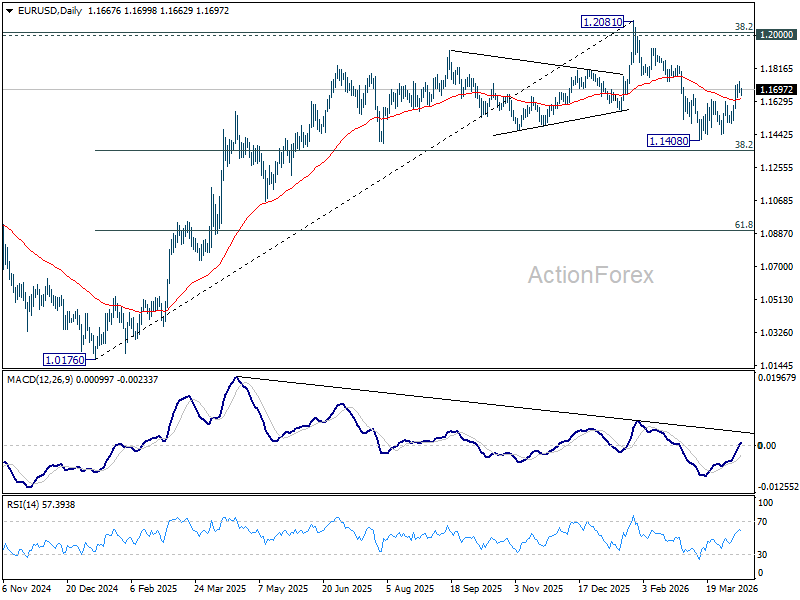
In the bigger picture, the strong support from 38.2% retracement of 1.0176 to 1.2081 at 1.1353 suggests that the pullback from 1.2081 is more likely a corrective move. Strong support was also found in 55 W EMA (now at 1.1513). Focus is back on 1.2 key cluster resistance level. Decisive break there will carry long term bullish implications. Nevertheless, break of 1.1408 support will revive the case of medium term bearish trend reversal.


