


TL;DR: Silver is outperforming Gold on the same Dollar weakness, with the Gold/Silver ratio rejecting resistance and Silver approaching its breakout trigger first — but whether Silver is genuinely leading Gold, or just outperforming it, depends on whether Gold follows through its own key level at 4,510.90.
Silver Is Doing More With the Same Dollar Tailwind
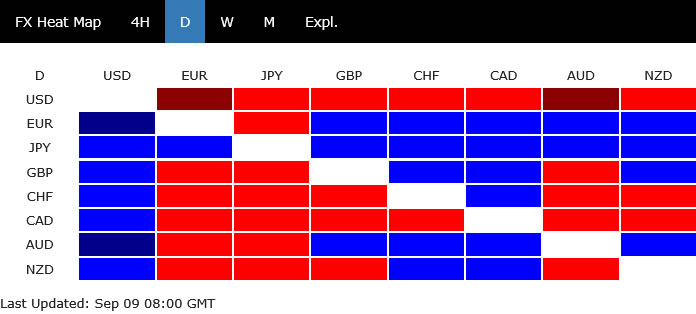
Gold and Silver are both benefiting from a weaker Dollar, but they aren’t trading that support the same way. Silver is outperforming, sitting around 66.89, above its four-hour 55 EMA at 66.34, while Gold remains near 4,411.26 and below its own four-hour 55 EMA at 4,433.28. The difference isn’t just a one-day move — it has been building for roughly two months in the Gold/Silver ratio, which has now turned lower again after another rejection from descending resistance.
That makes the ratio the natural place to start. The weaker Dollar explains why both metals can rise together. It doesn’t explain why Silver has repeatedly done better. Silver’s industrial role gives it a different demand structure from Gold’s purely monetary and financial characteristics, while the smaller Silver market can produce larger relative moves once momentum builds. Those mechanisms may help explain the divergence, but the stronger evidence is in the price relationship itself: the ratio has been falling since July.
The Ratio Has Rejected Exactly Where It Needed To
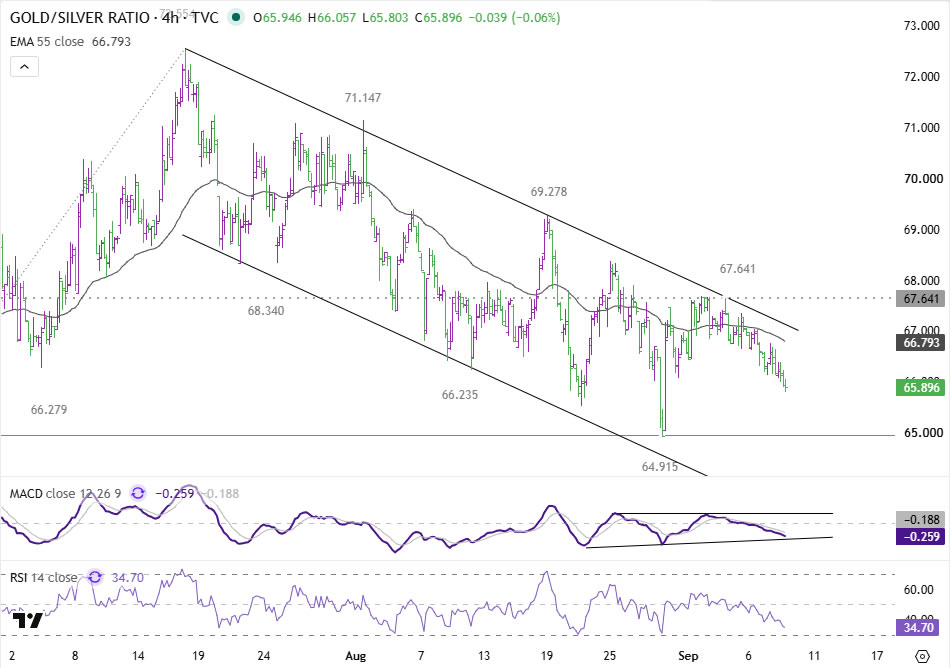
The Gold/Silver ratio fell to 64.92 in late August and then mounted a recovery to 67.64. That rebound ran directly into the descending resistance line that has capped the ratio throughout the broader decline, and it has now rolled over again to around 65.90.
The technical backdrop supports the reversal. The ratio remains below its four-hour 55 EMA at 66.79, MACD is negative and below its signal line, and RSI has dropped to around 34.70. Silver therefore retains the relative advantage while the descending trendline caps the upside.
But there’s an important distinction. The ratio has turned lower again; it hasn’t yet confirmed another extension of the downtrend. The next test is 64.92, the late-August low. A return there would complete most of the recent round trip from support to resistance and back. A decisive break below 64.92 would be the stronger signal that Silver’s relative strength is accelerating.
ActionForex’s Technical View on Silver: Reaching Its Trigger First
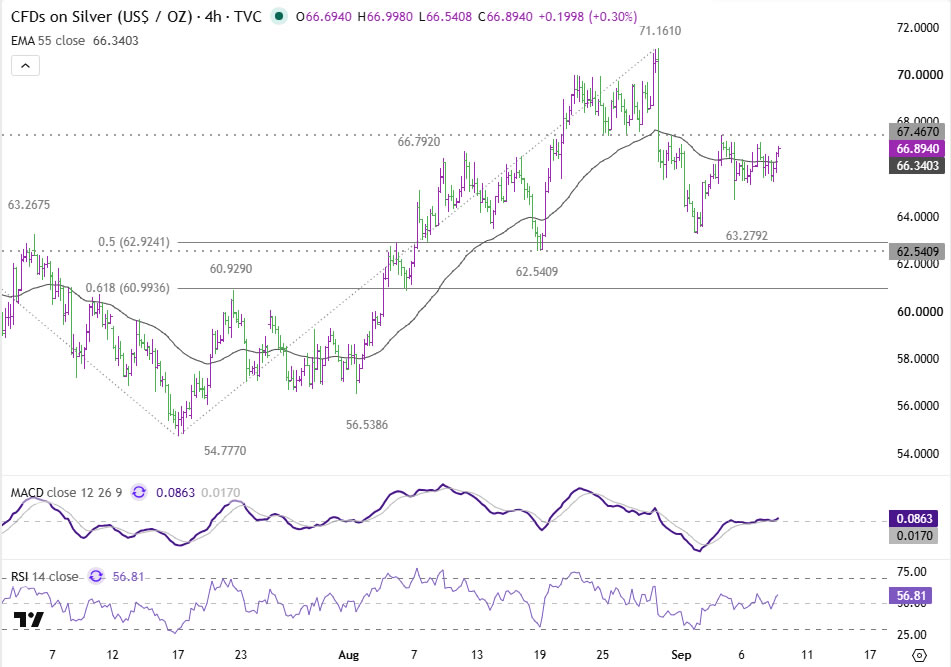
Silver itself is now approaching 67.47, which capped the previous rebound and provides the clearest immediate breakout level. The recovery from 63.28 has already carried price back above the four-hour 55 EMA at 66.34, while momentum has improved alongside it. MACD is positive at roughly 0.09 versus 0.02 for the signal line, and RSI has climbed to around 56.81.
A clean break of 67.47 would open the way for a retest of 71.16. More importantly, the move would be emerging from a technically solid foundation. The recent correction found support around 62.54–62.92, where a structural pivot overlaps closely with the 50% retracement of the entire rise from 54.78 to 71.16.
That confluence keeps the broader rise from 54.78 intact under the current wave interpretation. Silver is therefore not simply chasing higher from an extended condition — it has corrected, held a meaningful support zone, and is now attempting to restart the advance.
ActionForex’s Technical View on Gold: The Harder Part of the Test
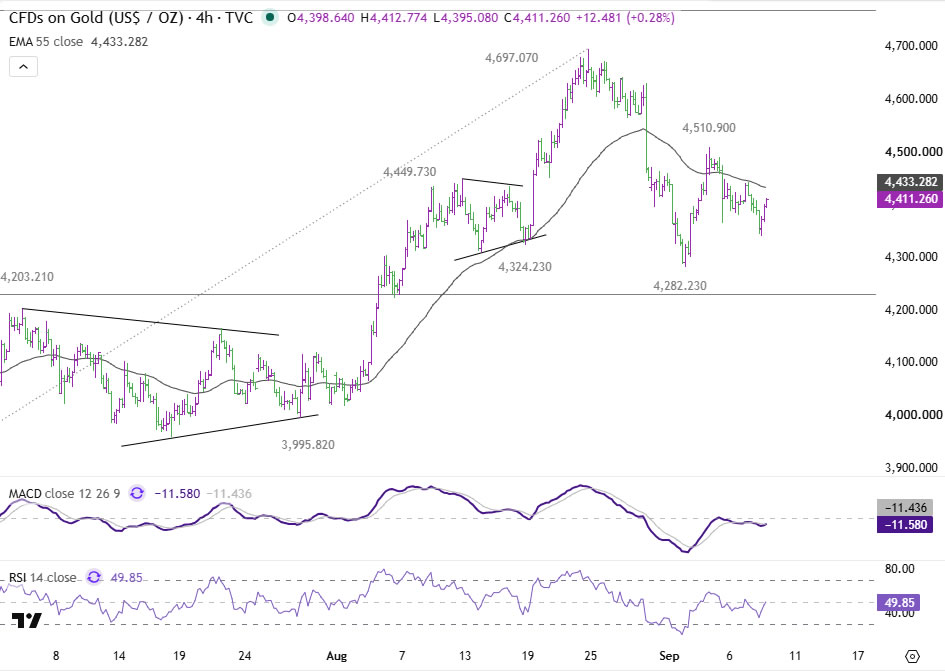
Gold hasn’t reached the same point yet. Its rebound from 4,282.23 stalled at 4,510.90, and price subsequently slipped back beneath the four-hour 55 EMA at 4,433.28. At around 4,411.26, Gold is showing much less momentum than Silver. RSI is almost perfectly neutral at 49.85, while MACD remains slightly negative.
That makes 4,510.90 the level that matters most for Gold. A firm break would suggest the decline from 4,697.07 completed at 4,282.23 and would reopen the way toward a retest of 4,697.07. Until then, Gold remains inside its corrective structure.
This difference is exactly why Silver is interesting as a possible leading indicator. Silver is already close to its breakout trigger. Gold is not.
Silver Can Lead, but Gold Has to Follow
There’s a tempting story here: Silver breaks 67.47, the ratio continues lower, and Gold follows through 4,510.90 shortly afterward. If that sequence happens, Silver’s relative strength would have provided an early indication that the broader precious-metals rebound was strengthening before Gold itself confirmed it.
But the thesis has an equally important failure condition. If Silver clears 67.47, runs toward 71.16, and the ratio falls through 64.92, while Gold remains capped below 4,510.90, then Silver wasn’t really leading Gold — it was simply outperforming it. The move could still be powerful, but it would be a Silver-specific relative trend rather than a signal that Gold was preparing for its own breakout.
That distinction matters because relative strength is observable. A leading relationship has to be demonstrated.
Three Numbers Will Tell Us Whether the Relationship Is Real
The setup now comes down to three levels. For Silver, 67.47 is the immediate trigger — a firm break backed by sustained MACD and RSI strength would open 71.16. For the Gold/Silver ratio, 64.92 is the confirmation point — a decisive break would show Silver’s outperformance accelerating beyond the recent pattern. And for Gold, 4,510.90 is the final test.
That last level is the most important for the broader thesis. Silver can outperform without telling us anything about Gold. But if Silver breaks first and Gold subsequently clears 4,510.90, the case that Silver was providing a genuine leading tell becomes much stronger.
Silver is closer to its breakout. Whether it’s actually leading Gold will only become clear if Gold eventually follows through its own.
Key Takeaways
- Silver is outperforming Gold on the same Dollar-weakness tailwind, a divergence that has been building in the Gold/Silver ratio for roughly two months.
- The ratio rejected resistance near 67.64 and has rolled over to 65.90, with 64.92 as the confirmation level for Silver’s relative strength accelerating further.
- Silver is approaching its own breakout trigger at 67.47, backed by a solid technical foundation after finding support at the 62.54-62.92 confluence zone.
- Gold’s equivalent trigger, 4,510.90, is further away, with the metal showing far less momentum (neutral RSI, slightly negative MACD) than Silver right now.
- Whether Silver is genuinely leading Gold, rather than just outperforming it, will only be confirmed if Gold also clears 4,510.90 after Silver breaks 67.47.





