
Commodity currencies continue to shine today with help of surge in copper prices. Aussie is so far the biggest winner, while Canadian Dollar is also strong. Sterling also gained in post-holiday trading on optimism of smoother Brexit negotiations ahead in 2018. While Dollar is weak, Swiss Franc and Yen are even weaker as markets are back in risk seeking mode.
LME copper surged to the highest level since 2014 on news that China’s is cutting production. Hitting as high as It’s also having a winning streak of nine days, longest since 2004. China’s authority orders largest copper producer Jiangxi Copper Co to stop production for at least a week for environmental impact assessments. That followed news that earlier in the month, the no. 2 producer Tongling Nonferrous Metals Group was asked to cut production. The news also boosted the two copper stocks in HK markets, with Jiangxi gained 3.4% while Tongling rose 0.7% in Shenzen. These gains were driven by expectation of further rise in copper price. The news also gave Australian Dollar a strong boost with AUD/USD powering through 0.7732 resistance to as high as 0.7775 so far.
Oil price slips slightly today but stays generally firm. WTI crude oil is trading at around 59.50, comparing to last week’s 58.50. WTI has indeed breached 60 handle earlier this week, for the first time since mid-2015. Explosion in Libyan pipeline is a key factor in the spike in oil price. The blast happened near 30km northwest of Marada. The surge in oil is giving Canadian Dollar a lift. USD/CAD dropped to as low as 1.2626 so far and is set to take on 1.5980 key support level.
Elsewhere, Japan housing starts dropped -0.4% yoy in November. Swiss UBS consumption indciator dropped to 1.47 in November, down from 1.68.
AUD/USD Mid-Day Outlook
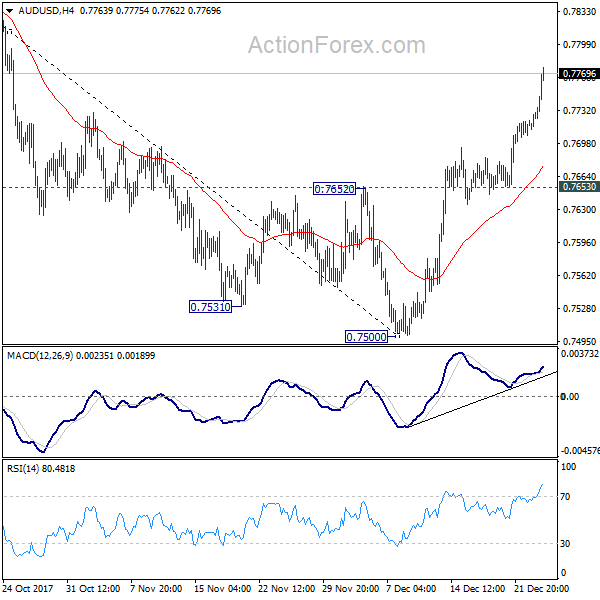
Daily Pivots: (S1) 0.7717; (P) 0.7723; (R1) 0.7734; More…
AUD/USD surges to as high as 0.7775 so far as rebound from 0.7500 extends. Current development suggests that the decline from 0.8124 is completed. It remains to be seen if rise from 0.7500 is an impulsive move. But intraday bias will stay on the upside for 0.7896 cluster resistance (61.8% retracement of 0.8124 to 0.7500 at 0.7886). On the downside, break of 0.7653 support is needed to indicate the completion of the rebound. Otherwise, further rise will remain in favor in case of retreat.
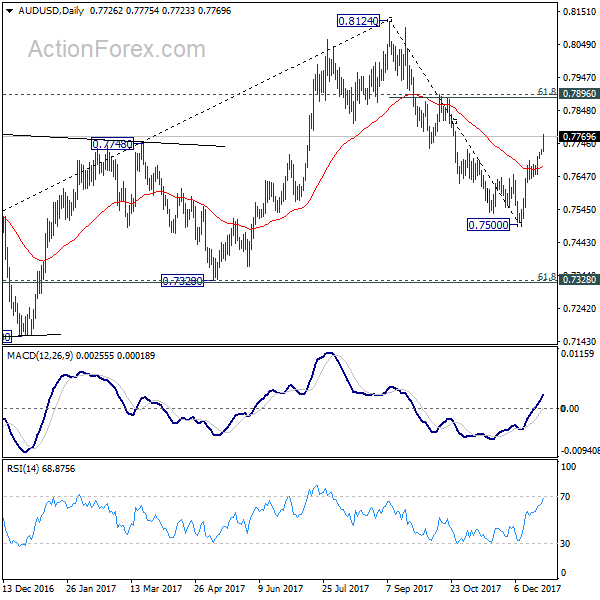
In the bigger picture, we’re still slightly favoring the case that corrective rise from 0.6826 medium term bottom is likely completed at 0.8124, after hitting 55 month EMA (now at 0.8034). But stronger than expected rebound from 0.7500 is dampening this bearish view. On the downside, break of 0.7500 will target 0.7328 key cluster support (61.8% retracement 0.6826 to 0.8124 at 0.7322) to confirm this bearish case. But break of 0.8124 will extend the rise from 0.6826 to 38.2% retracement of 1.1079 (2011 high) to 0.6826 (2016 low) at 0.8451 before completion.
Economic Indicators Update
| GMT | Ccy | Events | Actual | Forecast | Previous | Revised |
|---|---|---|---|---|---|---|
| 5:00 | JPY | Housing Starts Y/Y Nov | -0.40% | -2.60% | -4.80% | |
| 7:00 | CHF | UBS Consumption Indicator Nov | 1.47 | 1.54 | 1.68 | |
| 15:00 | USD | Consumer Confidence Index Dec | 128 | 129.5 | ||
| 15:00 | USD | Pending Home Sales M/M Nov | -0.50% | 3.50% |