
Global stock market crashed last week as the US finally joined the others. It should be reminded that as DOW made record high in early October, all other major markets suffered selloff already. It’s stretched to blame rising US treasury yields as a factor as it’s easy to see that yields haven’t took out prior week’s high before US stock market crash. To put the blame of the selloff on Fed is even more far-fetched. Just look at what happened. DOW enjoyed only a brief recovery when US released tamer than expected CPI reading on Thursday. US indices then ended another day in deep red. After all, the world is so interconnected that what goes around will almost certainly comes around. IMF’s downgrade of global growth forecasts is a proof of the impact of trade tensions started by the US, as also reflected in deteriorating German and Japanese investor sentiments. Such deterioration just went back to haunt the US and will continue to do so.
In the currency markets, Dollar ended the week broadly lower, except versus Canadian, after Trump attack the Fed as going crazy, wild, loco for rate hikes. Though, the greenback reclaimed some ground with a general consensus that Fed will continue with its professional world based on economic data, and ignore the ignorable. Swiss Franc was the third weakest despite risk aversion. Gold looked like the better safe haven asset. Yen ended the week as the strongest one, which was rather natural based on risk averse sentiments. But in a rare development, New Zealand Dollar was the second strongest, Australian the third.
As we discussed below, investors have just slightly pared back bets on Fed’s rate hikes despite Trump’s crazy attack on Fed. The retreats in US treasury yields are seen as nothing more than retreats in up trend. Such developments will continue to support Dollar and give it the strength for another rally eventually. Meanwhile, Euro will be weighed down, relative to Dollar, on sluggish German yield, which Italy is a constant drag. US stocks have entered into medium term correction and risks will continue to stay on the downside despite some interim recoveries, in tandem with global stocks. Japan 10 year JGB yield, currently at 0.15, would continue to find it very hard to move further away from BoJ’s allowed band of -0.1 to 0.1%. But risk aversion, in particular in Asia, could help support the Yen.
Markets pare back bet of 2019 hikes, but still more aggressive than a month ago
Let’s have a look at fed funds futures first. After Trump’s attacked on Fed and tamer than expected inflation reading, markets are paring some bets on Fed’s rate hikes next. But still, they remained relatively firm comparing to a month ago.
For March 2019, fed fund futures are pricing in 53.7% chance of two more hikes from now to 2.50-2.75%. That’s slightly lower than 57.1% a week ago but remained above 51.7% a month ago.
For June 2019, fed fund futures are pricing in 35.3% chance of another hike to 2.75-3.00%. That’s also slightly below 41.2% a week above but remained above 30.4% a month ago.
For September 2019, fed fund futures are pricing in 16.6% change of yet another hike to 3.00-3.25%. That compares to 23.3% a week ago and 13.8% a month ago.
We read that investors are relatively sure on Fed’s continuing of rate hike till hitting neutral zone. But beyond that, they’re not committing yet.
30-year yield and 10-year yield stay in up trend despite retreats
Now, let’s have a look at treasury yields. 30 year yield suffered quite a steep retreat after hitting 3.424. But so far, there is no clear sign of topping in TYX yet. It’s kept well above 3.247 resistance turned support. There is no divergence seen in daily MACD nor RSI. Current price structure suggests that rise from 2.925 is in an acceleration phase. Overall, as long as 3.162 support holds, we’d expect further rally in TYX to 100% projection of 2.651 to 3.247 from 2.963 at 3.559 in near term.
In the larger picture, TYX has just drew strong support from 55 week EMA. Some resistance is seen after hitting 61.8% projection of 2.102 to 3.201 from 2.651 at 3.327. But weekly MACD suggests that it’s actually building upside momentum again. So, there is no clear sign of topping. And we’d expect TYX to target 100% projection of 2.102 to 3.201 from 2.651 at 3.746 in medium term.
The picture in 10 year yield is a bit tricky. And, that’s why we presented the view on TYX first for better comparison. One might argue that firstly, TNX is facing strong resistance from the upper trend line. Bearish divergence is also seen in weekly MACD. And most importantly, it looks like rise from 2.808 is the fifth wave from 1.336. So there is risk of a major top.
It’s actually quite tempting to view it in the above bearish way. However, we’d like to point out that TNX’s consolidation from 3.115 to 2.808 is equivalent to TYX’s consolidation from 3.247 to 2.963. Rise from 2.651 to 3.247 is definitely not the third wave from 2.102. And TYX has already negated bearish divergence in weekly MACD. Therefore, rise from 2.808 is unlikely the fifth wave in TNX. Rally in TYX could instead help pull TNX through 100% projection of 1.336 to 2.621 from 2.034 at 3.313. And this will remain the favored case as long as 3.030 near term support holds.
So, overall, we haven’t seen the end of up trends in US treasury yields yet.
S&P 500 in medium term correction, more downside after interim consolidations
Now, let’s have a look at stocks. While we expected pull back in global equities, it was actually much worse than we’ve anticipated a week ago. And the development is very bearish. In a bearish yet not the worst view, S&P 500 has completed a five way up trend from 1810.10 to 2940.91. There was a beautiful wave four triangle that completed at 2691.99 and followed by a short wave five to 2940.91. Bearish divergence conditions appear in both weekly MACD and RSI. So, S&P 500 is now correcting the up trend from 1810.10 to 2940.91.
Initial support was seen after touching 55 week EMA and slightly above 2691.99 structure support. Some consolidations would now be seen but that should be relatively brief. We’d expect another fall soon that would send SPX to 38.2% retracement of 1810.10 to 2940.91 at 2508.94, to complete the first leg of a long term corrective pattern. That is, the worst in US stocks is far from being over.
DAX could break 11405 fibonacci level to 10888 before bottoming
DAX’s strong break of 11726.62 support last week confirmed resumption of the medium correction from 13596.89. In a less bearish scenario, DAX is now correcting the up trend from 9214.09 only. Based on current downside momentum, 50% retracement of 9214.09 to 13596.89 at 11405.49 should be taken out with relative ease. Strong support could only be found at around 61.8% retracement at 10888.31.
Shanghai SSE broke 2638.30 key support, resumed long term down trend
China Shanghai SSE has suffered steep selling despite PBoC’s measures to stabilize the markets. Key support level at 2638.30 (2016 low) was taken out. Downside risks are rather heavy if SSE cannot reclaim 2638.30 soon. But even so, outlook will stay bearish as long as 2827.34 resistance holds. Barring any government intervention (which is impossible to predict in a closed market with authoritarian government), the down trend should extend to 61.8% projection of 5178.19 to 2638.30 from 3587.03 at 2017.37, which is close to 2000 psychological level, in medium to long term.
Dollar index retreated well ahead of 96.98 high, drawing support from 55 day EMA
Now, back to Dollar index, It retreated quite notably last week and it’s now trying to draw support from 55 day EMA. For now, as long as 55 day EMA holds, we’d expect rebound from 93.81 to extend to retest 96.98 high. But we’d also maintain our view that there is not enough evidence to suggest up trend resumption yet. Hence, we’d be cautious on topping below 96.98 high. And the level is equivalent to 1.1300 bottom in EUR/USD.
On the downside, sustained trading below 55 day EMA might indicate completion of the rebound from 93.81. That would extend the consolidation pattern from 96.98 with another falling leg. But again, the range of the consolidation should have been set already. That is, another downside attempt should be contained by 38.2% retracement of 88.25 to 96.98 at 93.64, which is also close to 55 week EMA.
Overall, there is no deviation from our view last week. An eventual upside break out in Dollar index is expected. It’s just a matter of time.
Position trading strategy
We’ve reinstated our AUD/USD short strategy last week as China’s PBoC measures didn’t trigger much movements in the markets. AUD/USD short was entered at 0.7100 as the consolidation from 0.7040 extended. The position is last updated in this post, and you can trace back the updates from there.
The position is actually quite a disappointment to us. Global stocks tumbled, far worse then we expected. Chinese stocks even broke a key support level. But AUD/USD basically didn’t move at all. Looking back, it could be partly because AUD/USD was oversold in the prior week. And, some traders might start to rethink how far monetary policy divergence between Fed and RBA would extend to. But as we analyzed above, we’ continue to expect further rise in US yield and decline in global stocks. Thus, the conditions are still there for more decline in AUD/USD.
Technically, the corrective price actions from 0.7040 also affirmed our bearish view. So, we’ll hold on to the short position for now. The consolidation could have completed at 0.7139 with late Friday decline. But it’s not necessary to rush into such conclusion. Hence, we’ll keep the stop unchanged at 0.7185, slightly above 50% retracement of 0.7314 to 0.7040 at 0.7178.
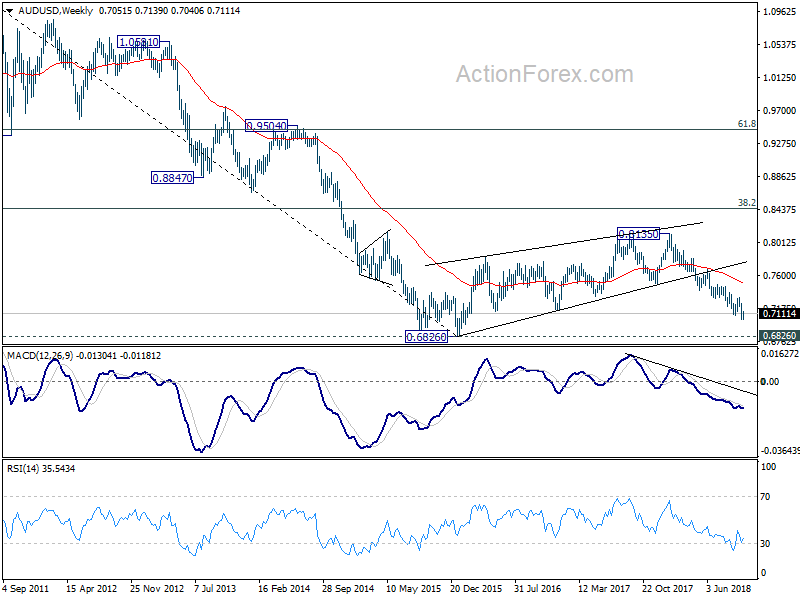
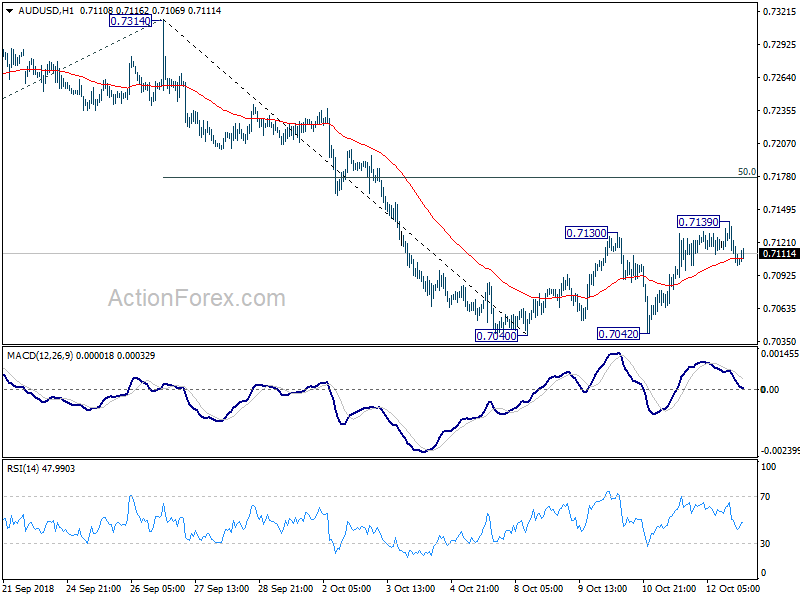 Our overall view is unchanged that medium term fall might be resuming long term down trend from 1.1079. Whether this more bearish view is right or wrong, there is realistic prospect of a test on 0.6826 low. The next move, after break 0.7040, should reveal how much downside momentum AUD/USD is having. And by then, we should be able to determine whether to exit the position around 0.6826 low, or hold it through.
So to summarize, hold short with stop at 0.7185, target to be determined later.
We’d refrain from adding other position first.
EUR/USD Weekly Outlook
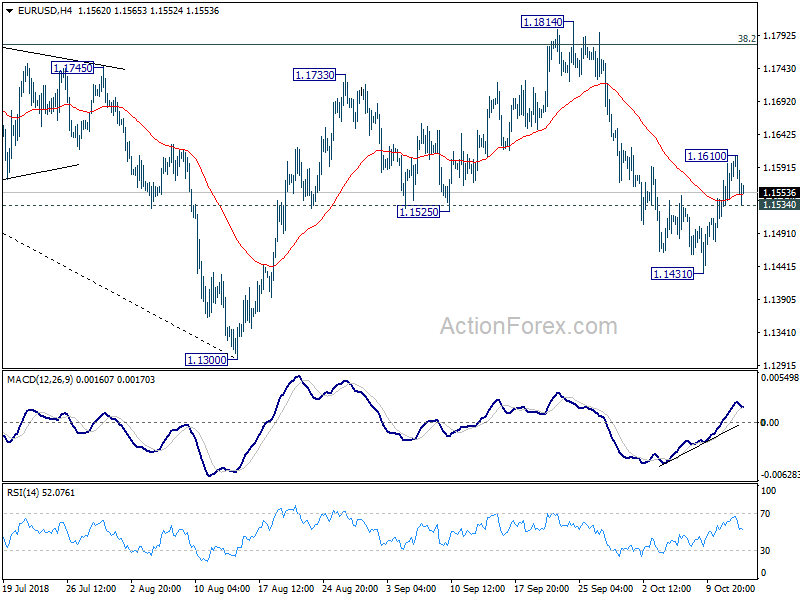
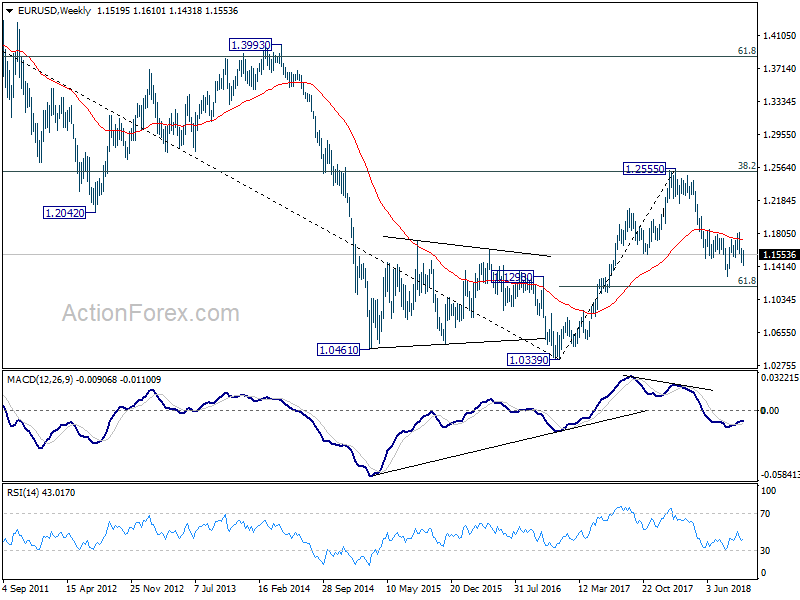
EUR/USD edged lower to 1.1431 initially last week but then recovered to 1.1610 before losing momentum after that. Initial bias remains neutral this week first. Another rise cannot be ruled out as long as 1.1534 minor support holds. Above 1.1610 will target 1.1814 resistance. But we’d expect upside to be limited by 1.1779/1814 resistance zone to bring down trend resumption eventually. On the downside, below 1.1534 minor support will indicate completion of rebound from 1.1431. Intraday bias will be turned back to the downside for 1.1431 and then 1.1300 low.
In the bigger picture, corrective pattern from 1.1300 could have completed at 1.1814 after hitting 38.2% retracement of 1.2555 to 1.1300 at 1.1779. Decisive break of 1.1300 will resume the down trend from 1.2555 to 61.8% retracement of 1.0339 (2017 low) to 1.2555 at 1.1186 next. Sustained break there will pave the way to retest 1.0339. On the upside, break of 1.1814 will delay the bearish case and extend the correction from 1.1300 with another rise before completion.
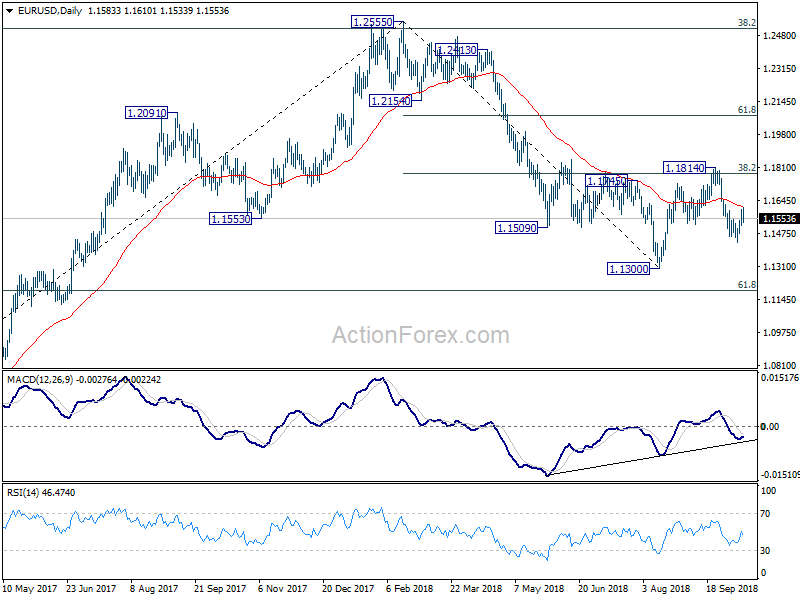
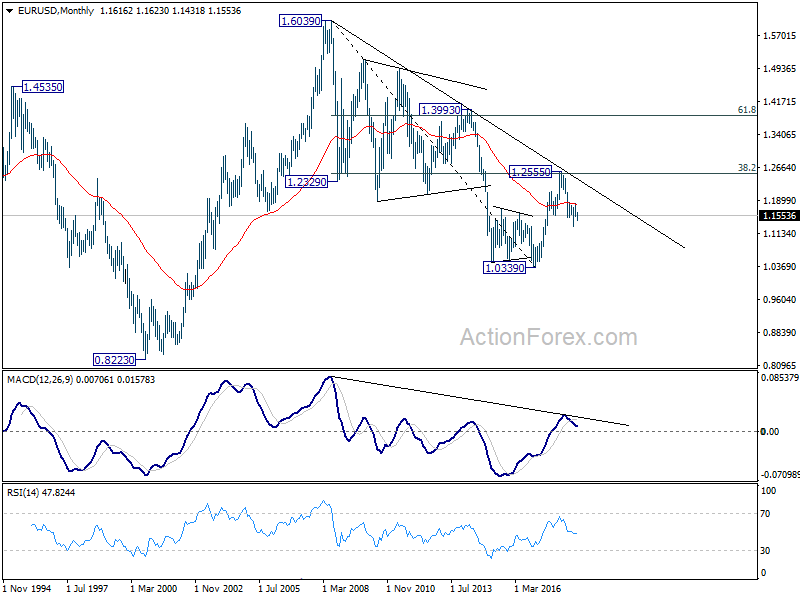
In the long term picture, the rejection from 38.2% retracement of 1.6039 to 1.0339 at 1.2516 argues that long term down trend from 1.6039 (2008 high) might not be over yet. EUR/USD is also held below decade long trend line resistance. Firm break of 61.8% retracement of 1.0339 to 1.2555 at 1.1186 should at least bring a retest on 1.0339 low.


