
What is a bigger driver of volatility in the markets, politics or monetary policy? Judging only from last week’s development, politics got the nod, at least in the US. Investor sentiments initially sank on report that Trump was ready impose more tariffs on China, as soon as in December. But then, markets took a U-turn after presidents of both sides held a “long and very good” telephone conversation on Thursday. Suddenly, there is hope for de-escalating US-China trade war with the Trump-Xi meeting as sideline of G20 summit in Argentina on Nov 30 – Dec 1.
Global equities rebounded on the news, with exceptional strength seen in Hong Kong. Chinese Yuan was also lifted sharply up from the psychologically important 7 handle. US treasury yields also staged a strong rally, with additional help from solid non-farm payrolls report. It should also be remembered that Sterling enjoyed a marvellous rebound on hope that there could be a Brexit deal for that extra EU submit in November. But of course, one could argue that the Pound was also supported by a slight hawkish turn in BoE’s new projections in the quarterly Inflation Report.
Over the week, New Zealand and Australian Dollar ended as the strongest ones, followed by Sterling. Yen and Swiss France were the weakest ones on return of risk appetite. Dollar staged a broad based rebound on Friday on NFP and treasury yields and ended just mixed.
Looking ahead, three central banks will meet this week, RBA, RBNZ and Fed. All are expected to stand pat and are unlikely to move the markets. Economic data like UK GDP, ISM services, New Zealand employment, etc could trigger some movements. But in the end, it’s likely US-China trade war, US mid-term election, Brexit negotiations, Italy-EU budget showdown that would determine the main directions.
30-year yield resumes up trend, 10-year yield to follow
While there were a lot of notable developments in the financial markets, we’d like to point to US treasury yield first. 30-year yield (TYX) surged through 3.424 near term resistance to resume medium term up trend. Near term outlook will now stay bullish as long as 3.300 support holds. Next near term target will be 100% projection of 2.651 to 3.247 from 2.963 at 3.559.
But we’re actually looking at 100% projection of 2.102 to 3.201 from 2.651 at 3.746 in medium term, which will then put 3.976 key resistance into radar.
10-year yield (TNX) is not too far behind and the rebound from 55 day EMA is also a bullish sign. Rally in TYX will likely help lift TNX through 3.248 resistance soon.
And in that case, 100% projection of 1.336 to 2.621 from 2.034 at 3.313 shouldn’t be too difficult to overcome. Next medium term target will be above 4% handle at 161.8% projection at 4.107.
S&P 500 rebounded, but correction not finished
S&P 500’s strong rebound from 2603.54 suggests near term stabilization. However, while further rally could be seen, upside attempts could be capped by surging treasury yields as well as political uncertainties after mid-term election. As long as 2816.94 resistance holds, the fall from 2916.50 is still in favor to extend lower.
Such decline is view as correcting the whole up trend from 1810.10. And 38.2% retracement of 1810.10 to 2940.91 should at least be tested before this falling leg completes. Though, break of 2816.94 will argue that the pull back has completed earlier than we expected and retest of 2940.91 high would then be seen.
Dollar index rejected but 96.98, but not giving up yet
Dollar index breached 96.98 key resistance to 97.02 but retreated sharply. It originally looked like the index was rejected by 96.98 already. But Friday’s late rebound raised the chance that the fall from 97.02 is merely a pull back and the rise from 93.81 is still intact. Now, further rise will be mildly in favor as long as Friday’s low at 95.98 holds. Break of 97.02 will confirm rise resumption for 97.87 fibonacci level next. But break will 95.98 will at least bring deeper pull back to 55 day EMA at 95.51.
Also, if the rise from 88.25 is confirmed to have resumed, firm break of 61.8% retracement of 103.82 to 88.25 at 97.87 will pave the way to retest 103.82 high.
Chinese markets responded well to trade breakthrough
The Chinese markets responded rather positively to the trade war news. USD/CNH’s sharp fall on Thursday and Friday suggests that a medium term top is formed at 6.9804, on bearish divergence condition in daily MACD, and 55 day EMA breached. That is, the offshore Yuan has defended the psychologically important 7 handle for now. Deeper decline is now in favor for 6.7817 and possibly back to 6.6960 (38.2% retracement of 6.2359 to 6.9804.
The Shanghai SSE closed the week at 2676.47, above 2675.40 near term resistance. The development reaffirmed the case of medium term bottoming at 2449.19, on bullish convergence condition in daily MACD. And, rebound from 2449.19 is likely resuming to correct the down trend from 3587.03. 55 day EMA (now at 2687.96) is the first hurdle. Break will solidify this bullish case and bring stronger rise back to 38.2% retracement of 3587.03 to 2449.19 at 2883.84. Though, there is still little prospect of reclaiming 3000 handle yet.
Position trading strategy
We currently have no position on hand. We mentioned last week that it’s about time for Dollar to have a bearish near term reversal. And it actually happened in a way. That is, GBP/USD led by rebounding ahead of 1.2661 key support. EUR/USD followed by rebounding off equivalent support at 1.1300. AUD/USD and NZD/USD may even be reversing the medium term trend. However, as noted above, the late rebound in Dollar index countered this bearish view. And, such rebound was supported by strong rise in US yield.
However, is the greenback ready to resume medium term rise? It doesn’t look very convincing too. US stocks are vulnerable to another fall as correction extends, in particular if that’s a response to rise in yield. And that would put some pressure on Fed’s rate hikes, which will in turn cap Dollar’s rally. Additionally, Dollar’s drain on emerging markets might be starting to reverse. USD/TRY’s recent fall is a clear example. And now it could be the turn of Chinese Yuan and Hong Kong Dollar. That would be another factoring that limit Dollar’s rally. So, we’d prefer to leave Dollar alone for now.
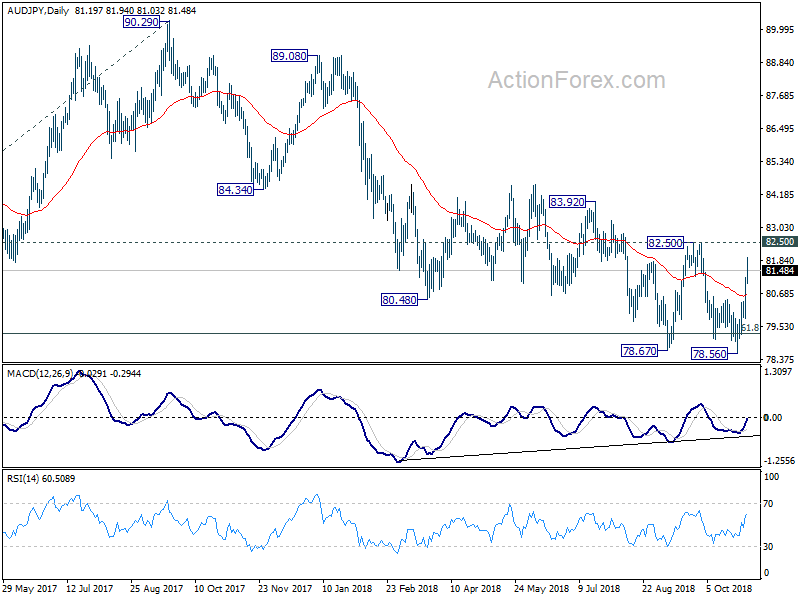
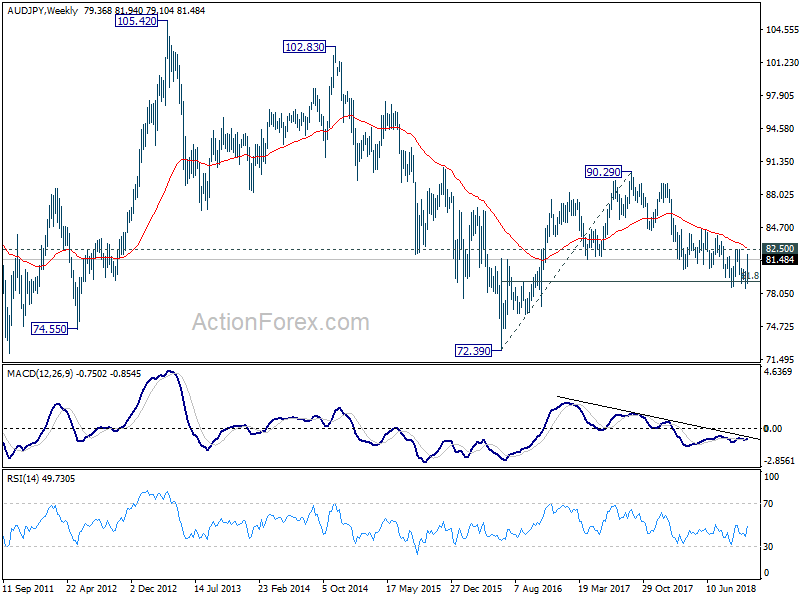
Meanwhile, if US-China trade conflict is really going into some resolution, AUD/JPY could be a pair to buy. Technically, bullish convergence in daily MACD provides the base of a trend reversal. It failed to sustain below 61.8% retracement of 72.39 (2016 low) to 90.29 (2017 high) at 79.22. Also, the cross could be forming a double bottom pattern (78.67, 78.56). Though, as with trading any pattern, it’s not advisable to jump the gun. So, we’ll be patient and wait for the double bottom to complete first. As the choppy fall from 90.29 is corrective looking, we’re seeing the prospect of at least retesting 90.29. So, it’s worth the wait.
GBP/USD Weekly Outlook
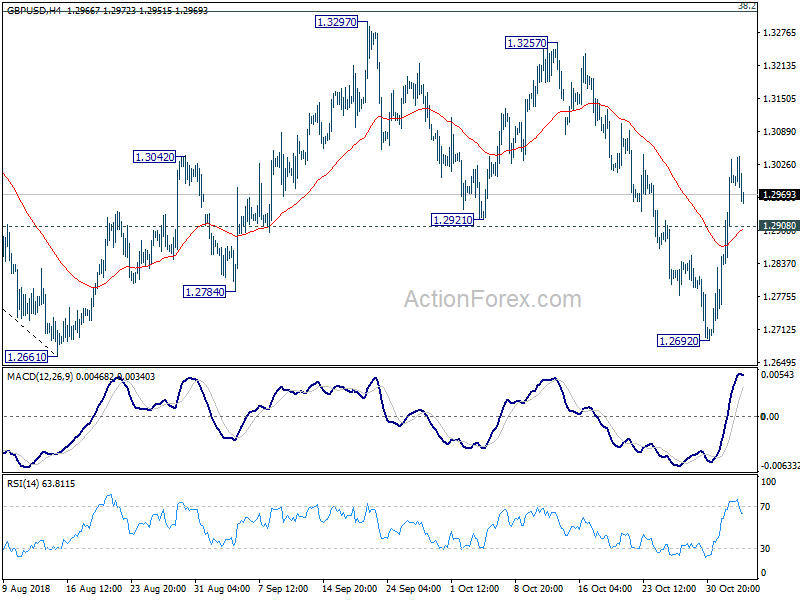
GBP/USD dipped to 1.2692 initially last week but rebounded strongly ahead of 1.2661 key support. The development suggests that fall from 1.3297 has completed and the consolidation pattern from 1.2661 is extending with another rising leg. Further rise is expected this week as long as 1.2908 minor support holds. Rise from 1.2692 should target 1.3297 resistance Nonetheless, we’d expect strong resistance from 1.3316 fibonacci level to limit upside to bring down trend resumption eventually. On the downside, below 1.2908 minor support will turn bias back to the downside for 1.2692 instead.
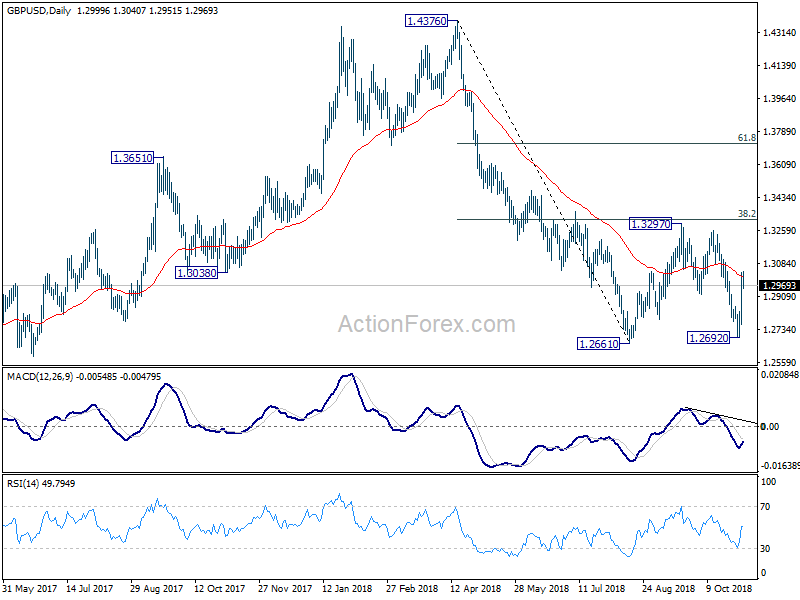
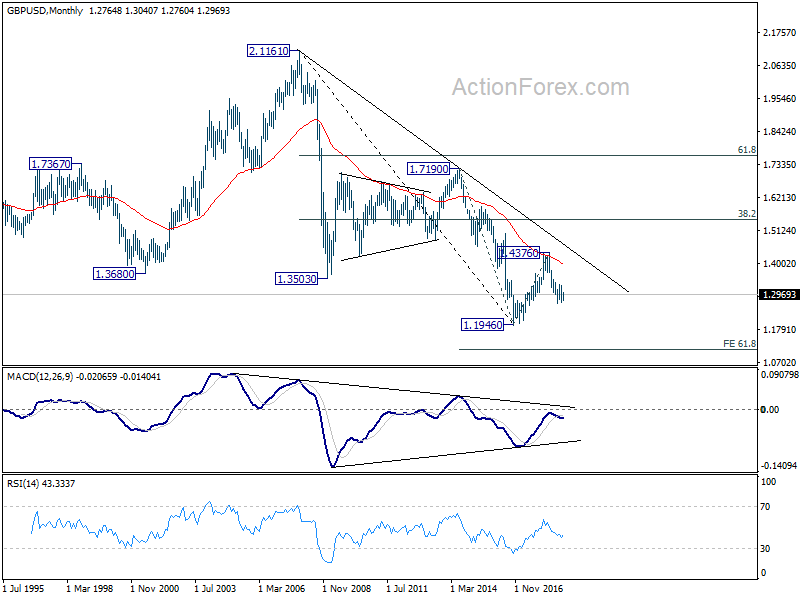
In the bigger picture, whole medium term rebound from 1.1946 (2016 low) should have completed at 1.4376 already, after rejection from 55 month EMA. The structure and momentum of the fall from 1.4376 argues that it’s resuming long term down trend. And this will be the preferred case as long as 38.2% retracement of 1.4376 to 1.2661 at 1.3316 holds. However, firm break of 1.3316 would bring stronger rebound to 61.8% retracement at 1.3721. And, the eventual depth of the fall from 1.4376, and the chance of hitting 1.1946 low, will depend on the strength of the interim corrective rebound from 1.2661.
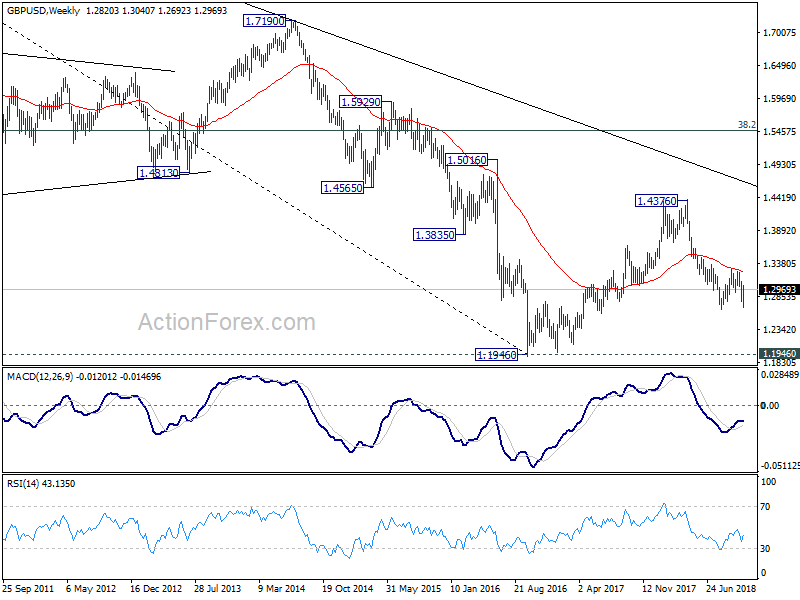
In the longer term picture, outlook in GBP/USD is held bearish. Rebound from 1.1946 was rejected solidly by falling 55 month EMA. The pair was limited well below 38.2% retracement of 2.1161 (2007 high) to 1.1946, as well as the decade long falling trend line. On break of 1.1946, next target will be 61.8% projection of 1.7190 to 1.1946 from 1.4376 at 1.1135.


