
US-China trade/currency war, no-deal Brexit, global slowdown and central bank easing were the main themes last week. The perceived risks to global economy were moving closer to materializing. Free fall in Chinese Yuan at the start of the week triggered US in designating China as currency manipulator. New 10% US tariffs on USD 300B in Chinese goods are coming on September 1. But it looks like tensions between the two countries would only increase, while there appears to be no ground for a deal.
Further, North Korea fired two short-range missiles on Saturday, which South Korea named as a “show of force” against US. The tests came a few hours after Trump said he received another “very beautiful letter” from North Korean leader Kim Jong Un. For now, there is no explicit link between North Korea’s move to intensification of US-China tensions.
Risks of no-deal Brexit on October 31 intensified too with neither EU nor UK appear to be doing something to avoid it. Economic data from UK and Germany were weak, reflecting increasing impacts from global uncertainties. RBNZ surprised the markets by cutting OCR by -50bps. All such developments send global equities and treasury yields lower. In particular, German 10-year yield hit another record low.
In the currency markets, New Zealand Dollar ended as the weakest one, RBNZ cut. Sterling was the second weakest on recession fear and no-deal Brexit risks. Australian Dollar was third weakest, as RBNZ could give additional pressure for RBA to cut interest rates ahead. Swiss Franc and Yen ended as the strongest ones on risk aversion and falling treasury yields. Looking ahead, Chinese Yuan and stocks remain the biggest source of risks to the global markets. We’d expect sentiments to continue to turn sour.
FTSE tumbled sharply despite Sterling’s depreciation
Sterling was the second weakest major currency last week. As October 31 Brexit deadline approaches, both UK and EU appear to have no intention to do something to restart negotiations. At the same time, both sides seemed to be rather prepared for no-deal Brexit, psychologically. The Pound was further pressured by surprised contraction in Q2 GDP, which raised recession fear.
On important development to note was the lack of support to stocks from Sterling’s depreciation. We’ve seen inverse relation between Pound and FTSE since the Brexit referendum, but not this time. This reflects deep concerns among UK investors, be it about Brexit, trade war or global slowdown.
FTSE’s sharp fall last week suggests that rebound rise from 6536.52 has completed at 7727.49, on bearish divergence condition in daily MACD. Immediate focus will be on 7079.71 support this week. Break will confirm this bearish case. More importantly, such development will suggests that corrective pattern from 7903.50 has already started the third leg. And deeper decline should be seen to 38.2% retracement of 3460.71 to 7903.50 at 6206.35 at least, before forming a bottom.
DAX weighed down by dim German outlook too
German DAX breached equivalent near term support of 11620.64 already. Export outlook is dim and even DIHK said a weak zero growth in export this year is already a success. Sustained break of 11620.64 in near term will confirm completion of rise from 10279.20, on bearish divergence condition in daily MACD. More importantly, corrective pattern from 13596.89 should then have started then third leg to 38.2% retracement of 35588.88 to 13596.89 at 9773.83 at least, before forming a bottom.
S&P 500 at juncture between 55 day and 55 week EMAs
US stocks continued to be relatively better than others even after last week’s selloff. S&P 500 is now at a critical juncture. It drew strong support from 55 week EMA and rebounded last week. yet, recovery was limited by 55 day EMA. The coming week or two would likely define the next move in the index. Break of 2822.12 should indicate rejection by 55 day EMA and in that case, we’d likely see further fall to 61.8% retracement of 2346. 58 to 3027.98 at 2606.87 at least. Though, sustained break of 55 day EMA will keep the index above 55 week EMA and put 3027.98 high back into focus.
US 10-year yield could be forming a bottom
US 10-year yield hit as low as 1.595 last week before recovery to close at 1.734. 78.6% retracement of 1.336 (2016 low) to 3.248 at 1.745 was already met. As noted before, considering oversold condition, we’d start to look for bottoming signal between 1.336 and 1.745. Break of 1.943 support turned resistance will indicate bottoming and we should then at least see a phase of corrective recovery. Such development should give some support to Dollar.
Chinese stocks and Yuan remain a main source of risks for everyone else
Chinese markets will continue to be a main source of uncertainty and risks for the global markets. Shanghai SSE dropped to 2821.49 last week. Subsequent mild recovery retains near term bearishness. Break of 2821.49 will extend the fall from 3288.45 to 100% projection of 3288.45 to 2838.38 from 3048.48 at 2598.41.
Also, USD/CNH took out the psychological important 7.0 handle last week and hit as high as 7.1399 before closing at 7.0941. 61.8% projection of 6.2359 to 6.9804 from 6.6704 at 7.1305 was also met. But upside momentum stays strong. We’d expect further rally ahead to 100% projection of 7.4149. Such development should trigger further selloff in China and global stocks.
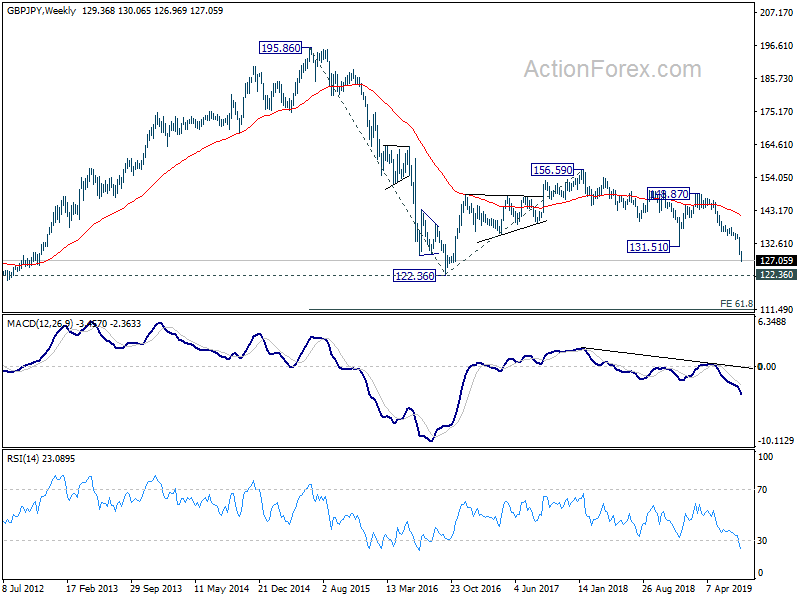
GBP/JPY Weekly Outlook
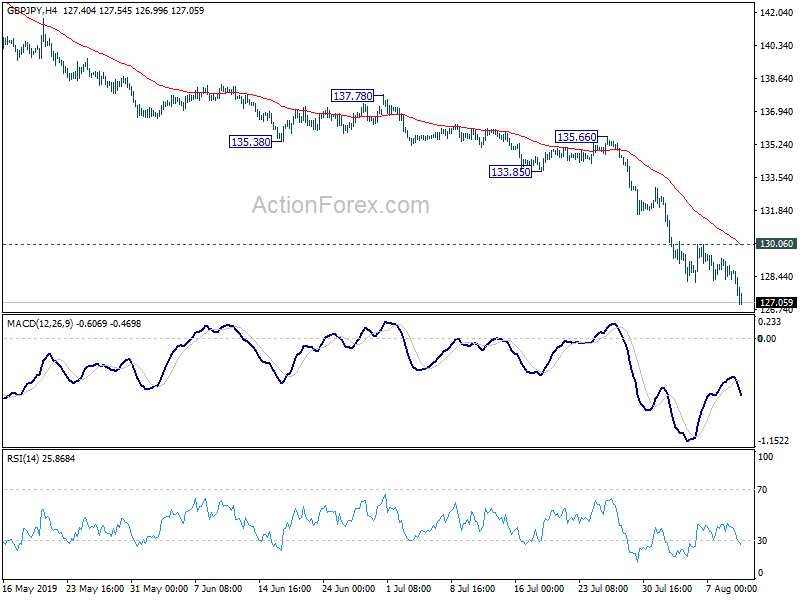
GBP/JPY’s down trend extended to as low as 126.96 last week. Initial bias stays on the downside this week for 122.36 low first. We’d be cautious on bottoming around there. On the upside, break of 130.06 resistance is needed to be the first sign of short term bottoming. Otherwise, outlook will remain bearish even in case of recovery.
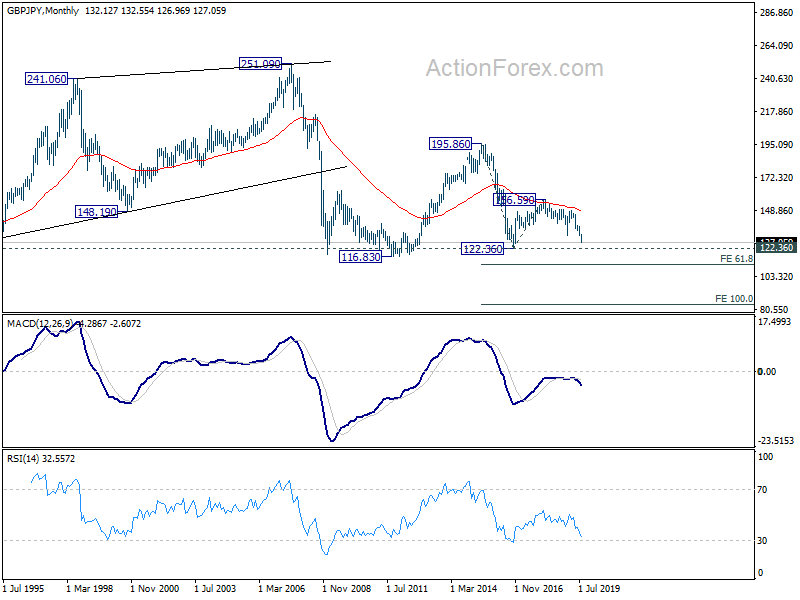
In the bigger picture, outlook remains clearly bearish with GBP/JPY staying well below 55 week and 55 month EMA. Medium term fall from 156.59 (2018 high) is still in progress. Next target is 122.36 (2016 low). We’d be cautious on bottoming there. But break of 135.66 resistance is needed to be the first sign of reversal. Sustained break of 122.36 will target next key level at 116.83 (2011 low).
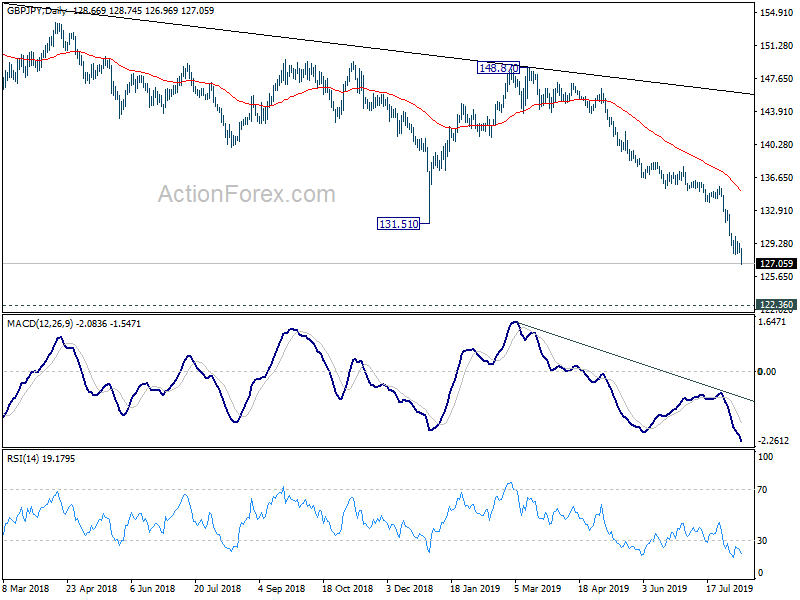
In the longer term picture, for now, we’re treating price actions from 122.36 as a corrective pattern that could extend with another rebound. Hence, strong support could be seen at 122.36 to bring rebound. However, sustained break will raise the chance of resuming larger down trend from 251.09 (2007 high). Next downside target will be 61.8% projection of 195.86 to 122.36 from 156.59 at 111.16.


