
The financial markets took a roller-coaster ride as 2020 started with a bang. US stocks jumped to new record higher to celebrate new year. But sentiments took a great turn after abrupt escalation in Middle-East tensions. Safe-haven flows into Gold, Yen and US treasuries came in unison. Oil prices also surged in response.
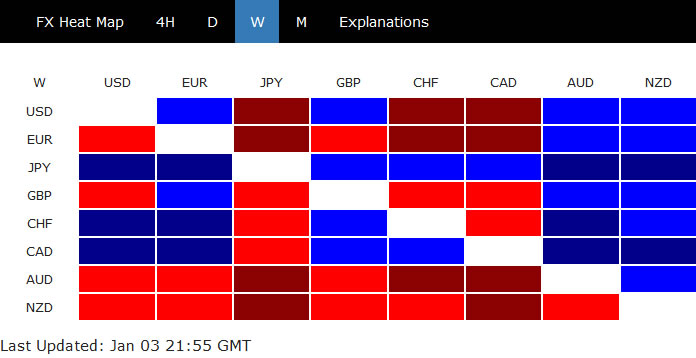
In the currency markets, Yen and Canadian Dollar were the strongest ones last week. New Zealand Dollar and Australian Dollars were the weakest, followed by Euro. Dollar was somewhat caught in the middle. The greenback somewhat staged a strong rebound against Sterling, Euro, Aussie and Kiwi. But it also suffered steep selloff against Yen and Loonie. Looking ahead, we’d expect risk aversion and falling yields stay as hindrance to Dollar’s rebound attempt. Meanwhile, Australian Dollar is probably setting up for deep fall should risk aversion intensifies.
Dollar index still in corrective fall despite rebound attempt
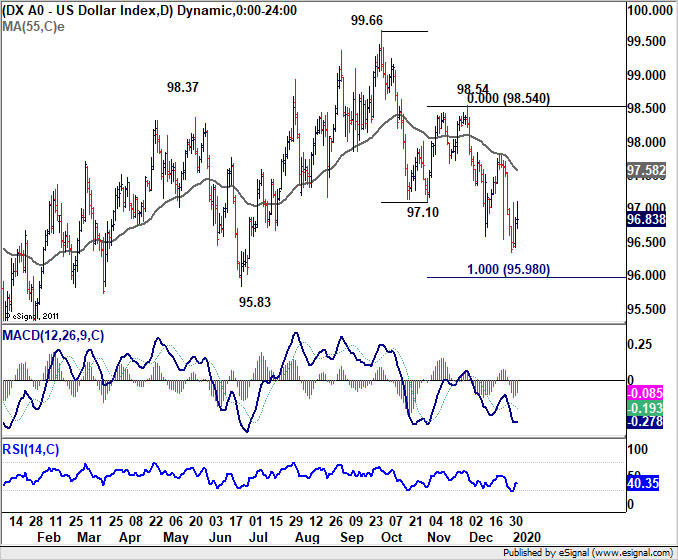
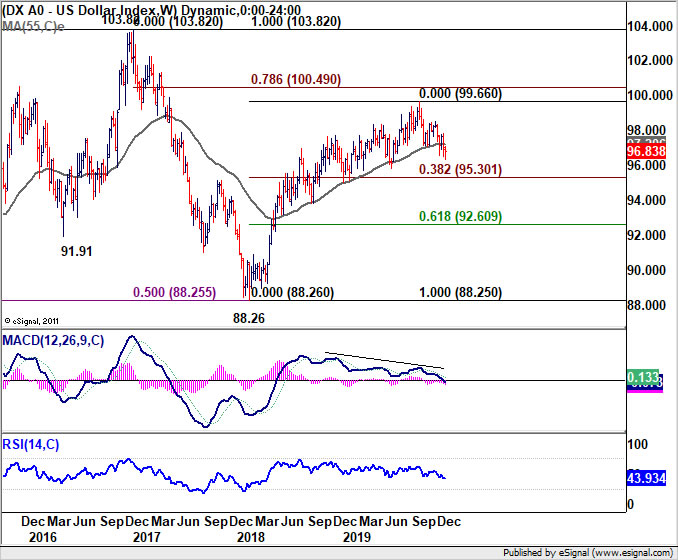
After being sold off broadly initially last week, Dollar staged a notable rebound towards the end of the week. But the performance of Dollar index was not too convincing, mainly thanks to selloff in USD/JPY. DXY is staying in the fall from 99.66 high. It’s still on track to 100% projection of 99.66 to 97.10 from 98.54 at 95.98 and possibly below.
Technically, as the structure of the decline suggests it’s a correction, we’d expect strong support from 38.2% retracement of 88.25 to 99.66 at 95.30 to contain downside, at least on the first attempt, to bring rebound. Sustained break of 55 day EMA will bring stronger rebound through 98.54 resistance. However, that would very much depends on how risk aversion, treasury yields and USD/JPY play out.
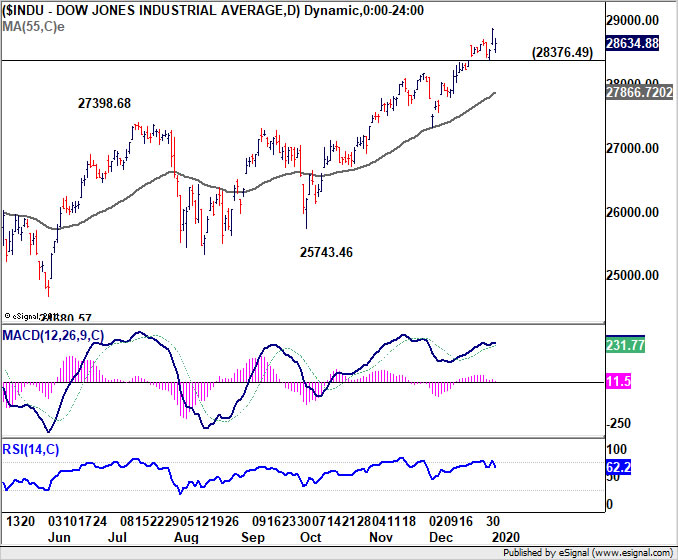
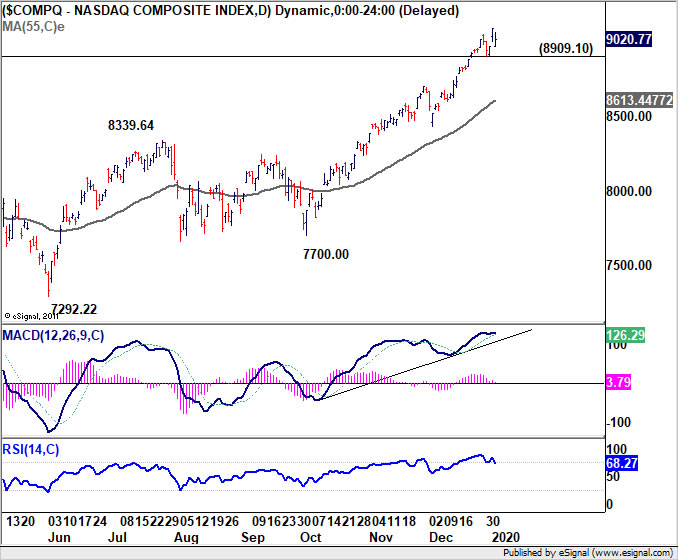
DOW and NASDAQ pressing key resistance, risk pull back
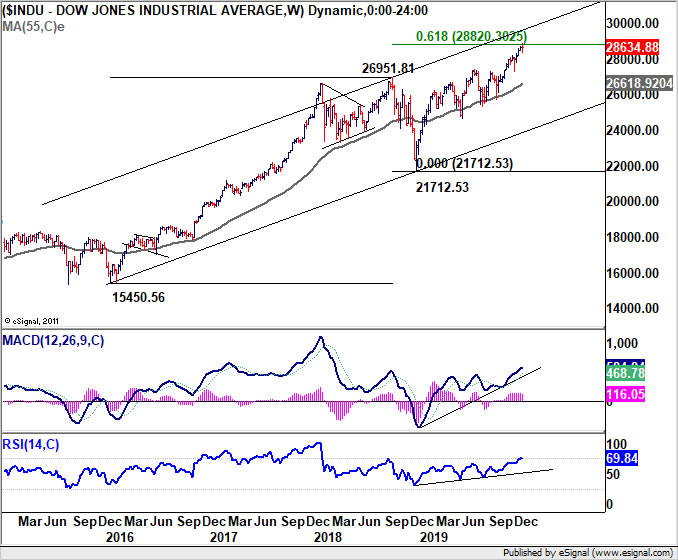
Major US indices hit record highs last week. While there was some set back on Friday due to Middle East tensions, the pull back was not too serious. However, both DOW and NASDAQ are now pressing key resistance levels. Some form of profit-taking pull back is possible should tensions escalate.
DOW hit 61.8% projection of 15450.56 to 26951.81 from 21712.53 last week but couldn’t sustain above it. As long as 28376.49 support holds, further rally is still in favor to long term channel resistance. But break of this support will indicate short term topping. We might see deeper pull back to 55 day EMA (now at 27866.72).
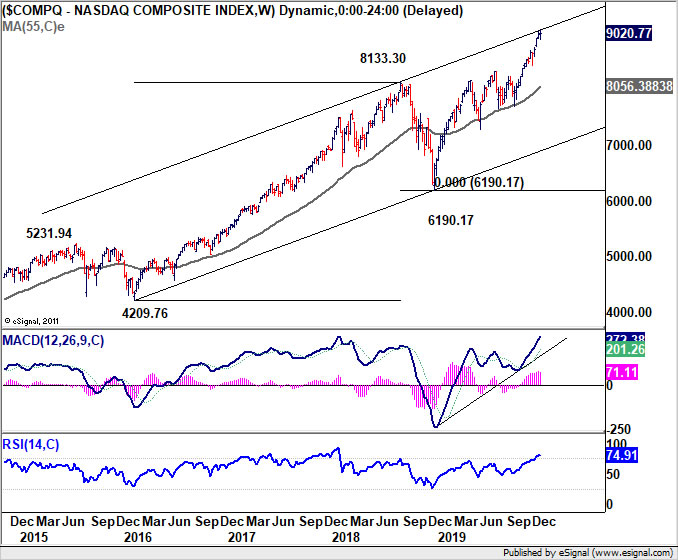
NASDAQ, on the other hand, is pressing long term channel resistance. Break of 8909.10 support will also indicate short term topping and bring pull back to 55 day EMA (now at 8613.44).
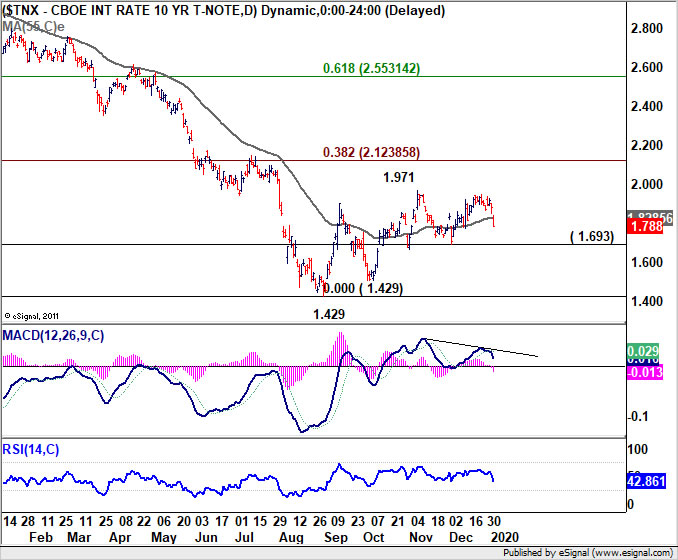
10-year yield heading back to 1.693, but not further bearishness seen yet
10-year yield dropped sharply on Friday to close at 1.788 last week. Last rally attempt was clearly rejected below 1.971 resistance. For the near term, deeper fall is likely for 1.693 support. However, break there is needed to confirm completion of whole corrective rise from 1.429. Otherwise, near term outlook is neutral, with risk slightly tilted to the upside, for another rally attempt through 1.971. But that would only happen at a later stage when sentiments are right.
Oil and Gold jumped on risk aversions
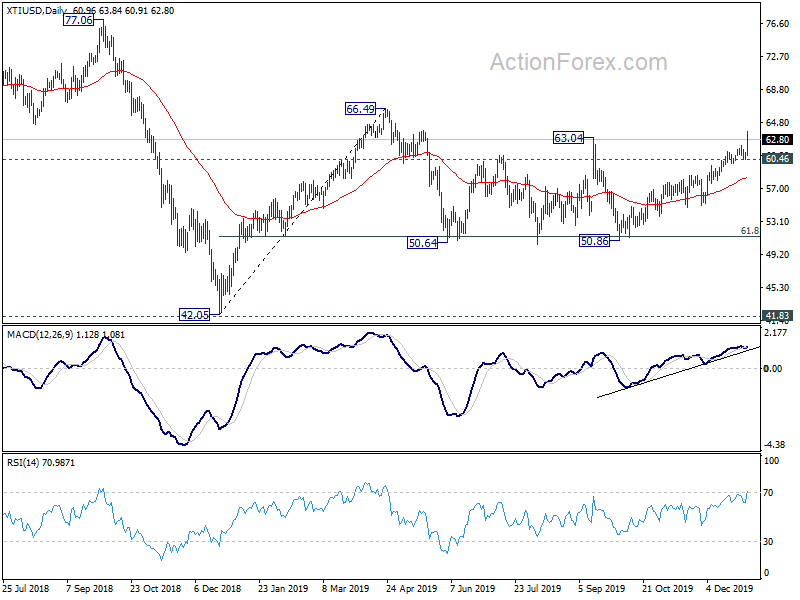
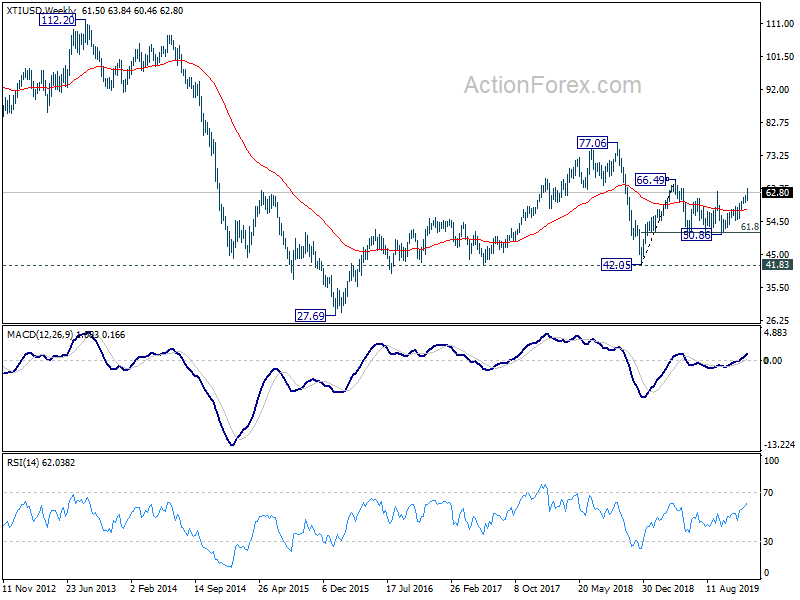
Oil and gold are two main beneficiaries of Middle East tensions last week. WTI oil breached to as high as 68.34 last week. But at this point, there was no clear follow through buying above 63.04. Further rise will remain in favor as long as 60.46 support holds. But we’d continue to extend strong resistance inside 63.04/66.49 zone to limit upside to bring reversal. We’re not expecting break out from established range between 50.64/66.49 yet. Break of 60.46 would indeed turn outlook bearish for 55 day EMA and below.
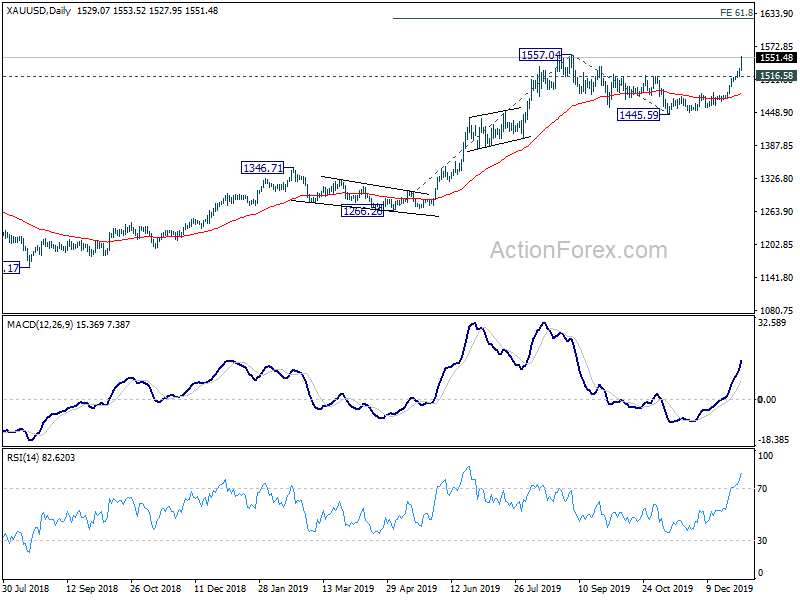
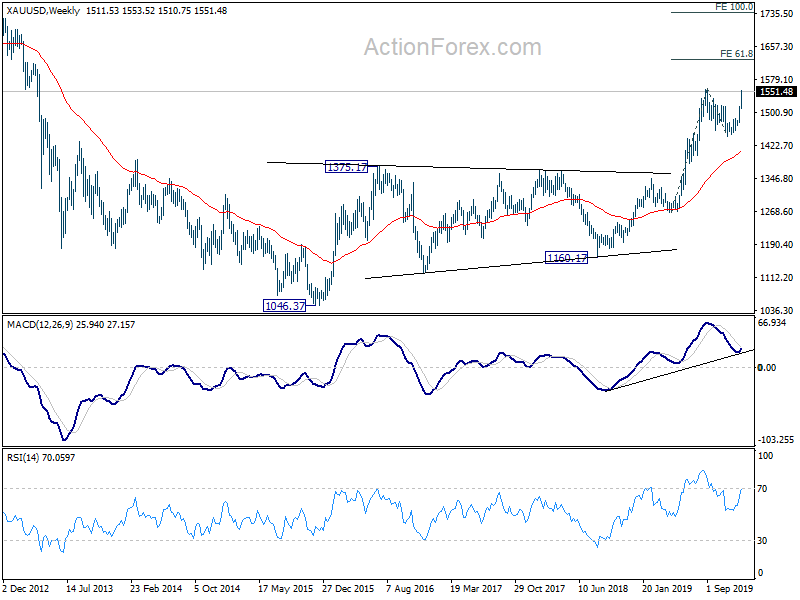
Gold’s strong rise suggests that up trend form 1160.17 is ready to resume very soon. 1557.04 resistance should be taken out without much difficulty this week. Next target is 61.8% projection of 1266.26 to 1557.04 from 1445.59 at 1625.29. However, , as the current rally could be the fifth leg of the five-wave sequence from 1160.17. We’d look for topping signal around 1625.29. On the downside, break of 1516.58 support will delay the bullish case and extend the consolidation pattern from 1557.04 with another fall first.
Aussie building up bearishness as corrective rises look completed
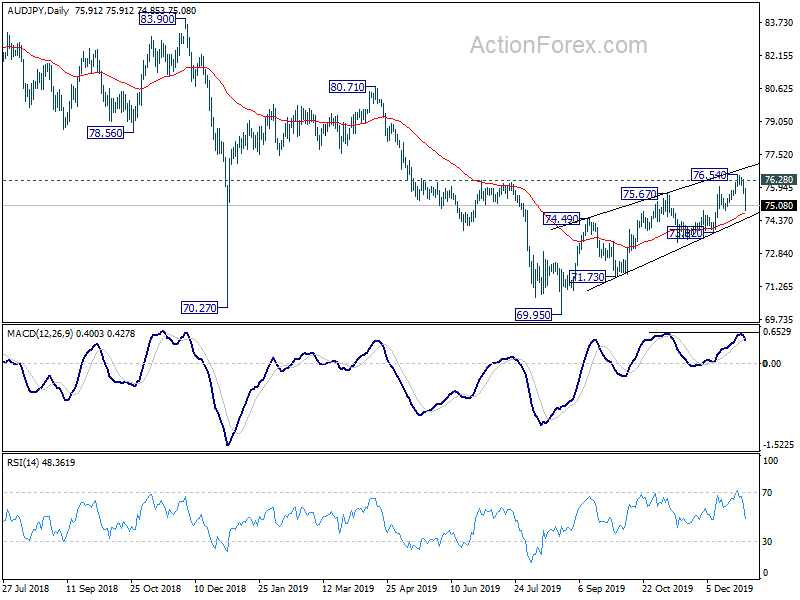
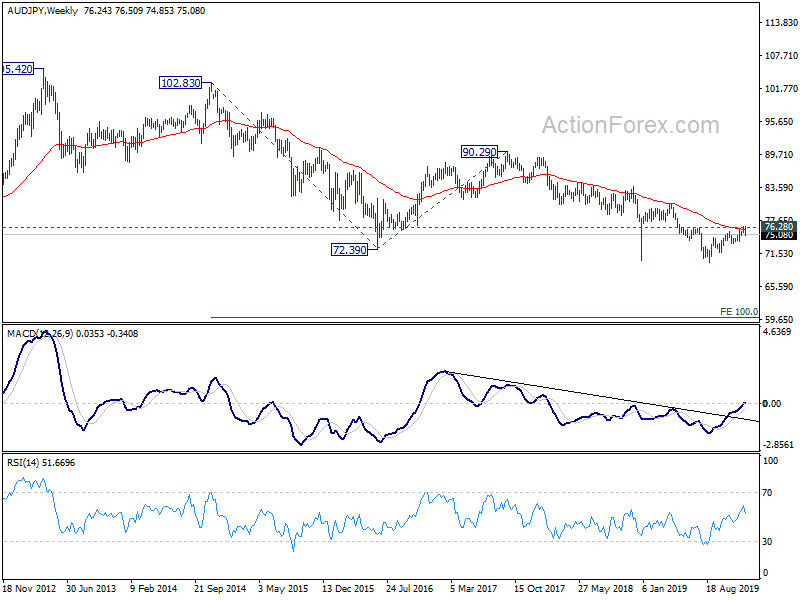
AUD/JPY is among the top two biggest mover last week, together with NZD/JPY. The steep selloff of Friday suggests that the pair has failed to sustain above key structural resistance at 76.54. The development keeps our bearish view intact so far. That is, choppy recovery from 69.95 was merely a corrective move. Considering that AUD/JPY has also been rejected by 55 week EMA too, such corrective rise could have already completed at 76.54. Immediate focus will be on 55 day EMA (now at 74.72) this week. Sustained trading below will solidify this bearish case. Further break of 73.82 support should confirm and target retest of 69.95 low.
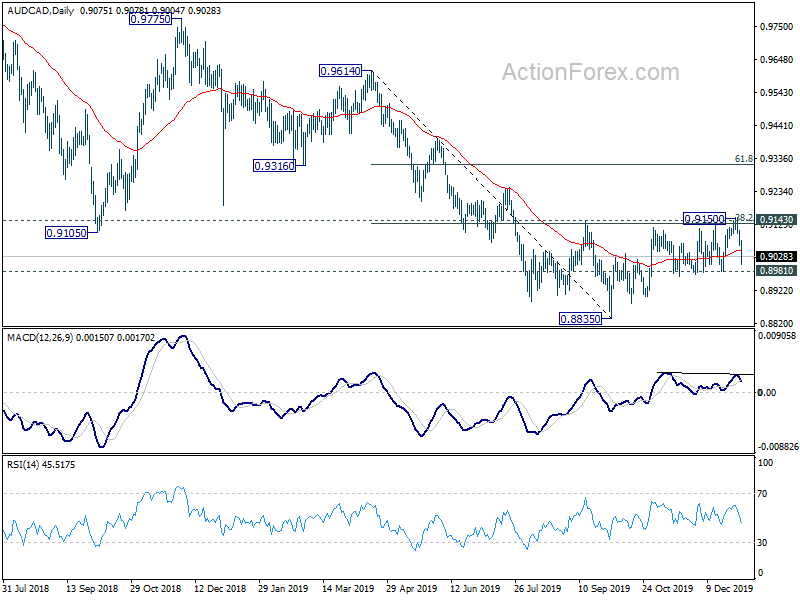
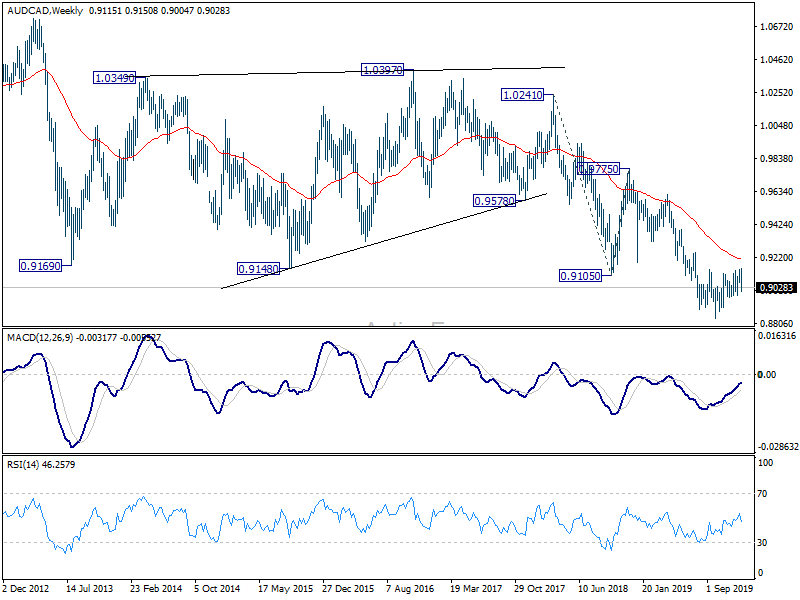
AUD/CAD’s corrective recovery from 0.8835 could have completed at 0.9150 too, after breaching 0.9143 cluster resistance (38.2% retracement of 0.9614 to 0.8835 at 0.9133). Immediate focus is now on 0.8981 support this week. Break will bring retest of 0.8835 low. Long term down trend also remains intact with AUD/CAD staying well below 55 week EMA.
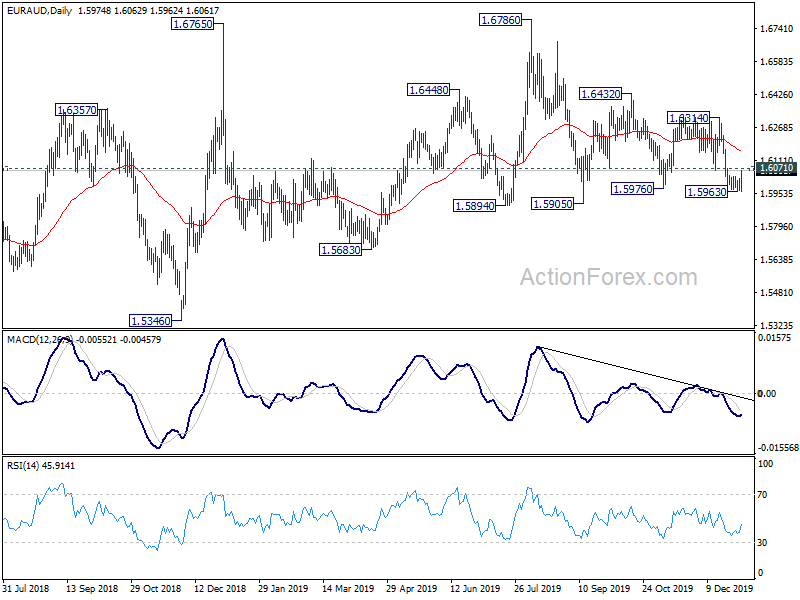
Elsewhere, EUR/AUD recovered notably ahead of 1.5894/5905 key support zone. Break of 1.6071 minor resistance this week should indicate short term reversal in the cross for rebound. AUD/USD’s corrective rise from 0.6670 might have completed ahead of 0.7082 resistance too. Overall, there is downside potential in Aussie, for at least a test on recent lows against Yen, Canadian and Dollar. It’s a bit early to confirm but the development this week should reveal the selling potential.
GBP/JPY Weekly Outlook
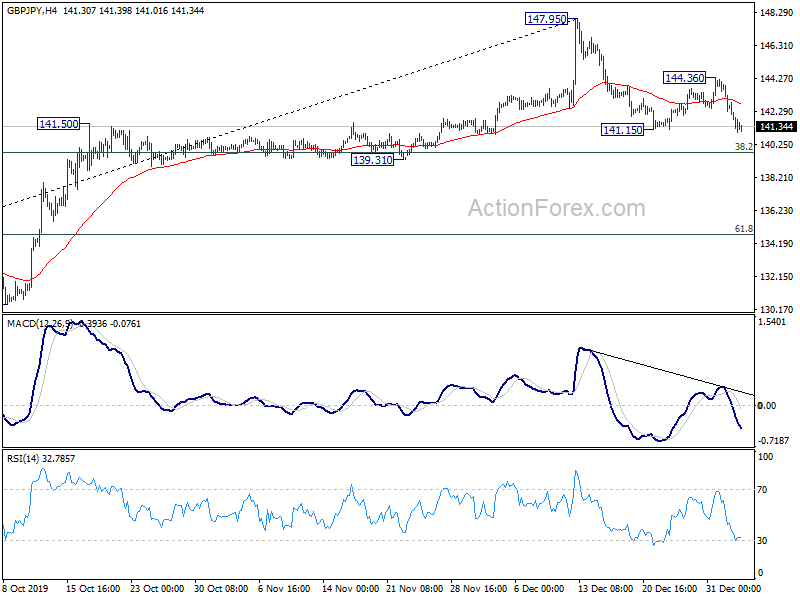
GBP/JPY reversed after recovery to 144.36 last week and breached 141.15 on subsequent fall. The development suggests that corrective fall from 147.95 short term top is resuming. Initial bias is mildly on the downside this week for 38.2% retracement of 126.54 to 147.95 at 139.77. At this point, we’d expect strong support from 139.31/77 to bring rebound. But in any case, risk will stay on the downside as long as 144.36 resistance holds, in case of recovery. Sustained break of 139.77 will pave the way to 61.8% retracement at 134.71.
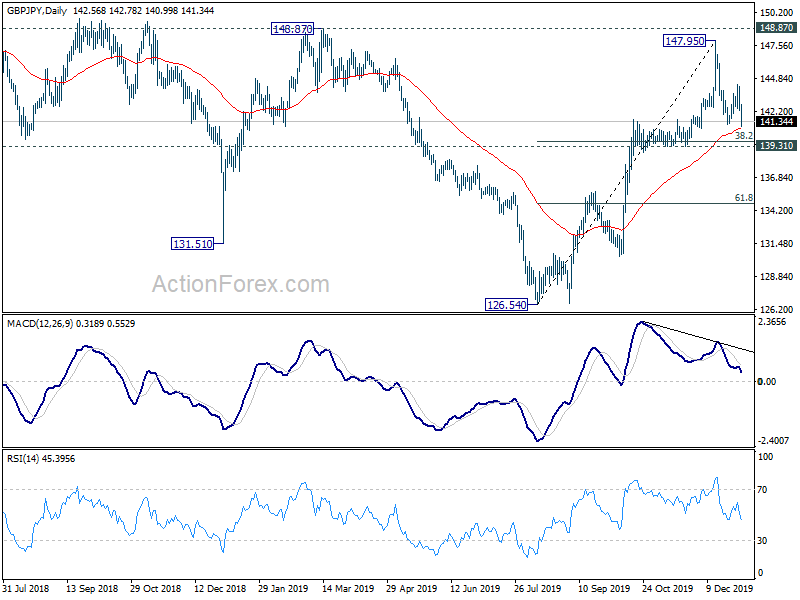
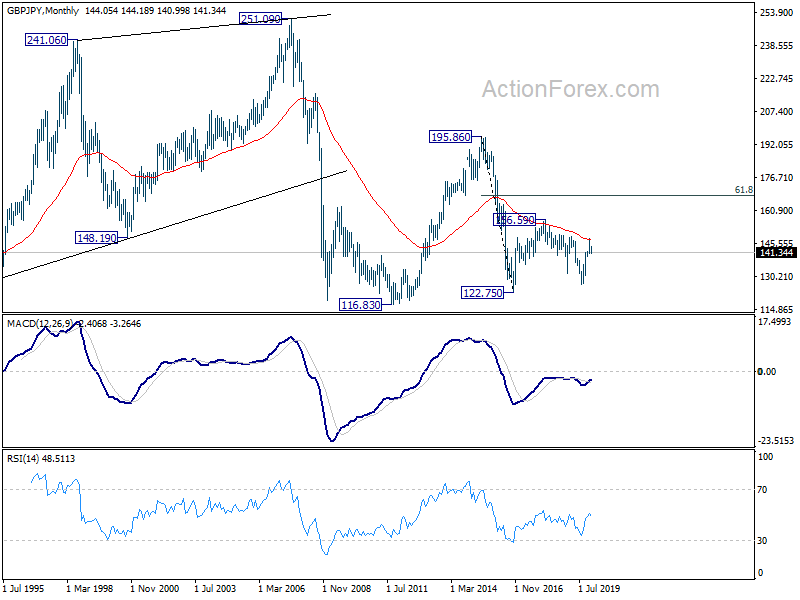
In the bigger picture, rise from 126.54 could either be the third leg of the consolidation pattern from 122.75 (2016 low), or the start of a new up trend. In either case, further rally is expected as long as 139.31 support holds, into 148.87/156.59 resistance zone. Reaction from there should reveal which case it should be in. However, sustained break of 139.31 support will dampen this case and turn medium term outlook neutral first.
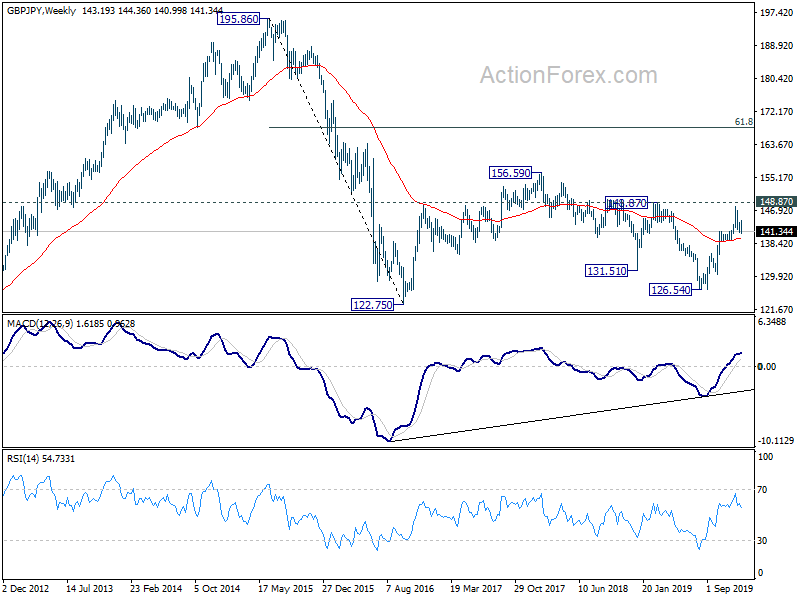
In the longer term picture, in spite of the current strong rally, there is no confirmation of long term bullish reversal yet. Focus is now on 156.59 key resistance. As long as it holds, another decline through 122.75 could still be seen. But firm break of 156.69 should at least bring further rally to 61.8% retracement of 195.86 to 122.75 at 167.93.


