
Global equities tumbled notably last week, partly as coronavirus spread was hitting new record highs. Also of the same importance, US investor had lightened up their positions in preparation for the Presidential elections. Yen and Dollar surged broadly to end as the strongest one. Euro was the worst performing, on return to coronavirus lockdown, and expectation of ECB easing in December. Australian Dollar was not too far away as second weakest, as traders await RBA rate cut this week. Canadian Dollar was pressured by steep fall in oil prices too.
Volatility is guaranteed in the upcoming days as traders adjust their positions, either based on the continuation of the current US administration, or a new one. We’re not going to speculate on the outcome of the race between Donald Trump and Joe Biden. Nor are we gong to speculate too much on market reactions. Though, we’d discuss some key levels to pay attention, which might indicate something beyond knee-jerk reactions.
S&P 500 extending consolidation only, no trend reversal yet
While S&P 500 ended notably lower last week with other major US indices, it’s seen as being in the third leg of the consolidation pattern from 3588.11 only. Break of 3209.45 support cannot be ruled out as the selloff continues. But the real important support lies in 38.2% retracement of 2191.86 to 3588.11 at 3054.74. Up trend from 2191.86 would remain intact as long as this 3054.75 fibonacci level holds. On the upside, sustained break of 55 day EMA (now at 3368.77), which is inside last week’s gap, is needed to confirm completion of the decline. Any fluctuations between two levels would be seen as post-election knee jerk reactions only.
10-year yield still maintaining rally from 0.504
10-year yield continued to work hard to stay in the near term rise from 0.504. As long as 0.746 support holds, things in the bond markets would be seen as status quo. We’re not expecting any drastic rally through 0.957 resistance no matter who wins the election. Such bullish development would be more dependent on the medium term development of the coronavirus pandemic. However, a solid break of 0.746 would an important signal of reversal in TNX, which would then be used to double confirm any bearish trend reversal in stocks.
HSI to gauge the bet on US-China relations
Hong Kong HSI is worth a note, as it could reflect how investors perceive US-China relations after the election. HSI has been rather resilient, in the sense that selloff from 26782.61 hasn’t accelerated downwards. The base case for us is for the index to gyrate downward through 23124.25 to retest 21139.26 down the road. However, a break above 24970.59 resistance would be seen as return of optimism over US-China relations. We wouldn’t expect that to happen if Trump wins. But a Biden win, follow by this scale of HSI rally, could be a big hint on what’s next.
Dollar index to stay range bound in any case
Dollar index’s development could be a bit tricky. While it’s dominated by the development in EUR/USD, the moves in USD/JPY couldn’t be totally ignored. A break of 94.72 resistance could be seen, which corresponds to break of 1.1612 support in EUR/USD, on risk aversion. However, if risk aversion does become serious, say with S&P 500 breaking the above mentioned fibonacci level, treasury yield could dive and prompt downside acceleration in USD/JPY through 104.00 support. Such development could cap Dollar index’s rally.
On the other hand, in terms of strong risk appetite, we’re won’t expect up trend resumption in EUR/USD through 1.2011 high for now. That’s based on the expectation of more serious lockdown in Europe as well as ECB easing in December. Hence, a break through 91.74 support in Dollar index is not envisaged too. So, range trading will likely continue between 91.74 and 38.2% retracement of 102.99 to 91.74 at 96.03, probably with any election result.
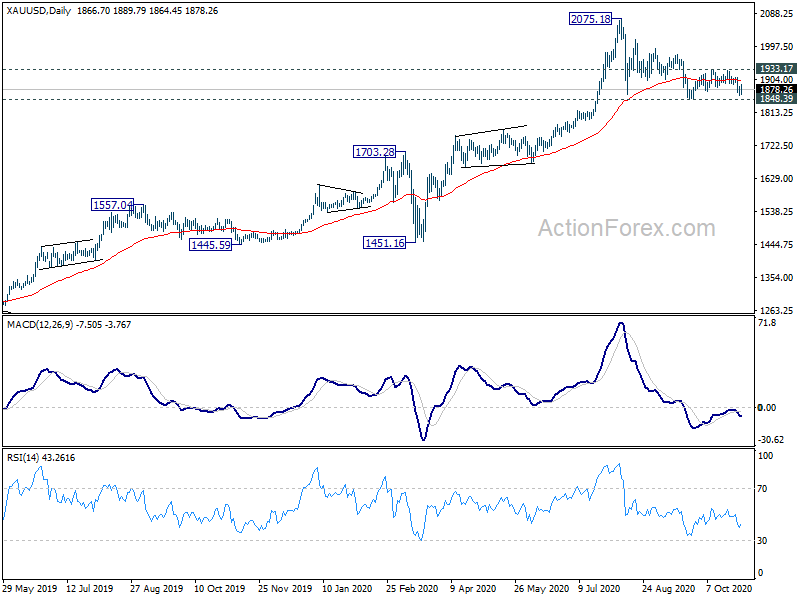
Gold near term bearish, but refuses to break out yet
The lack of direction in Dollar index is somewhat reflected in Gold too, which refused to make up its mind to break out of range. Still, there is currently some bearish flavors in the development with Gold struggling to sustain above 55 day EMA. Daily MACD was also rejected by zero line. Fall from 2075.18 is more likely to extend lower than not. Break of 1933.17 resistance is needed to indicate completion of the correction. For the near term, we won’t be seriously looking at the chance of Dollar index breaking through 91.74 low until this happens.
AUD/USD Weekly Outlook
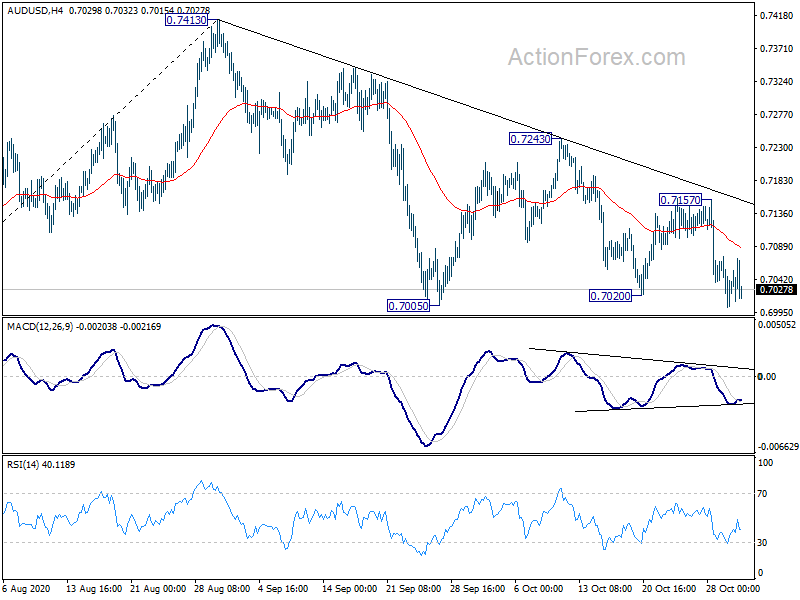
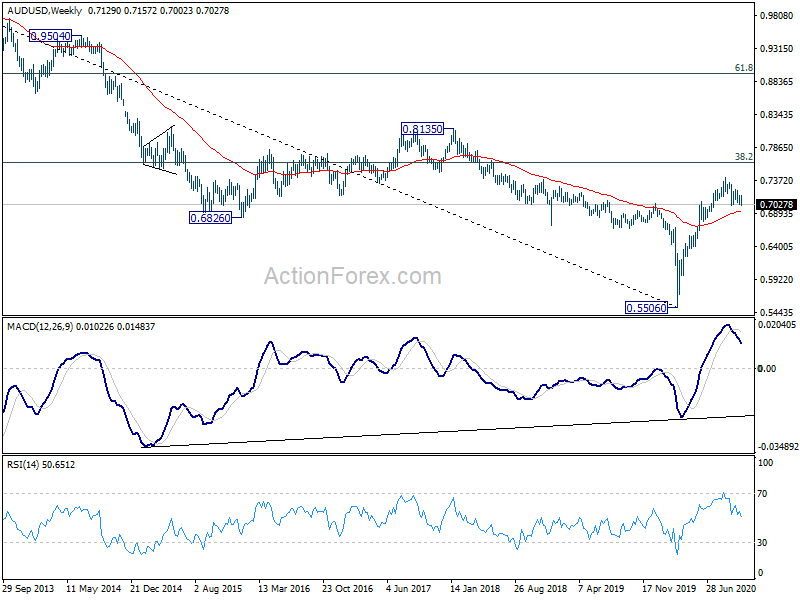
AUD/USD edged lower last week but couldn’t sustain below 0.7005 support yet. Initial bias stays neutral this week with focus on 0.7005. Decisive break there will confirm resumption of the corrective fall from 0.7413. Deeper decline would then be seen to 38.2% retracement of 0.5506 to 0.7413 at 0.6685. For now, downside breakout will remain in favor as long as 0.7157 resistance holds, in case of recovery.
In the bigger picture, while rebound from 0.5506 was strong, there is not enough evidence to confirm bullish trend reversal yet. That is, it could be just a correction inside the long term down trend. Sustained trading back below 55 week EMA (now at 0.6927) will favor the bearish case and argue that the rebound has completed. Focus will be turned back to 0.5506 low. On the upside, break of 0.7413 will extend the rise from 0.5506 to 38.2% retracement of 1.1079 (2011 high) to 0.5506 (2020 low) at 0.7635.
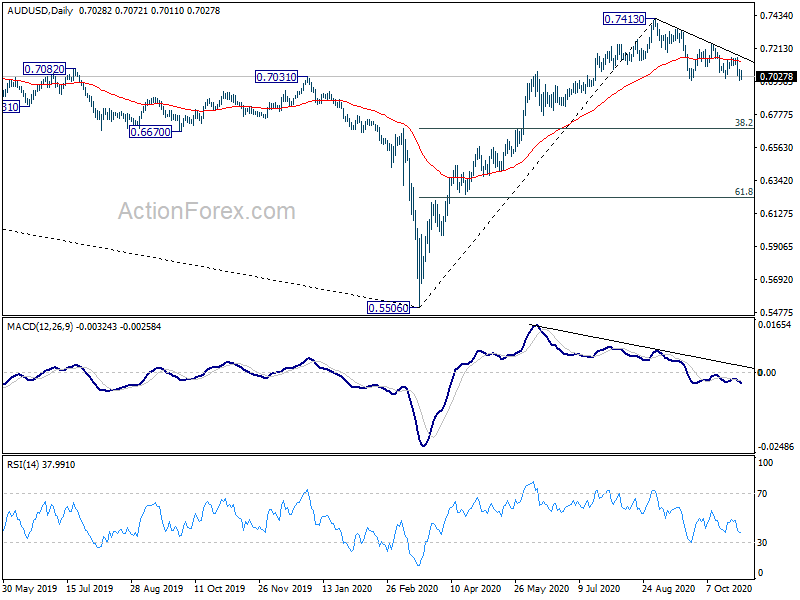
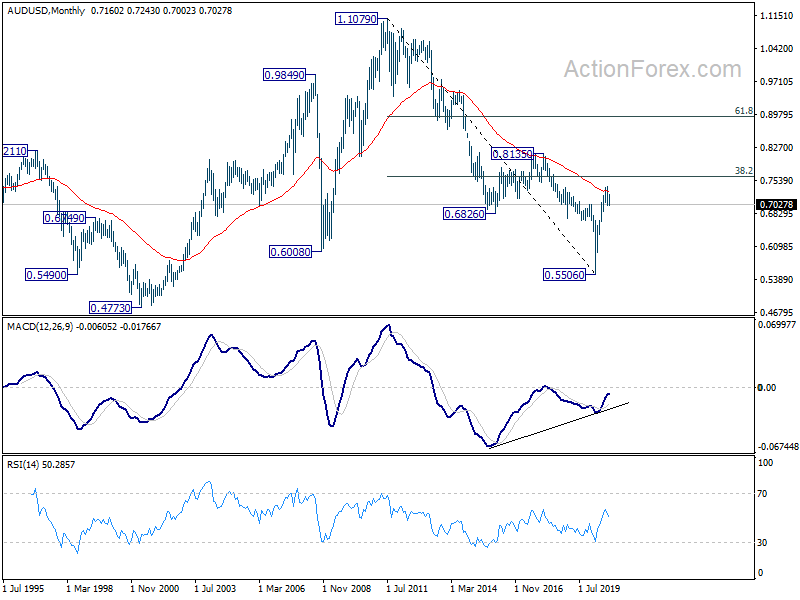
In the longer term picture, bullish convergence condition in monthly MACD is a condition for long term bullish reversal. Yet, AUD/USD struggled to sustain above 55 month EMA (now at 0.7306). It’s also limited below 38.2% retracement of 1.1079 (2011 high) to 0.5506 (2020 low) at 0.7635. Hence, there is not enough evidence for reversal yet. Down trend from 1.1079 could still extend through 0.5506 at a later stage.


