
Market debates heated up last week with the influx of some US economic data. On the other hand, the concerns on overheating inflation was legitimate given the much stronger than expected headline and core CPI reading from the US. On the other hand, poor retail sales, and prior week’s non-farm payroll data, gave a nod to Fed’s patience approach. It would likely take some more months of data before judging whether inflation is there to last. In particular, could recent price hikes be embedded back into expectations, which feed back into more hikes.
Volatility in the markets was high as a result. Yet, DOW and S&P 500 stayed comfortably, and healthily, in medium term up trend after the post CPI selloff. 10-year yield also failed to ride on the intra-week rally for an upside breakout. In the currency markets, Dollar’s decline appeared to have slowed somewhat, but it’s still vulnerable to more selloff, at least for the near term. While Aussie ended as the worst performing, it’s overall development wasn’t too bearish at all.
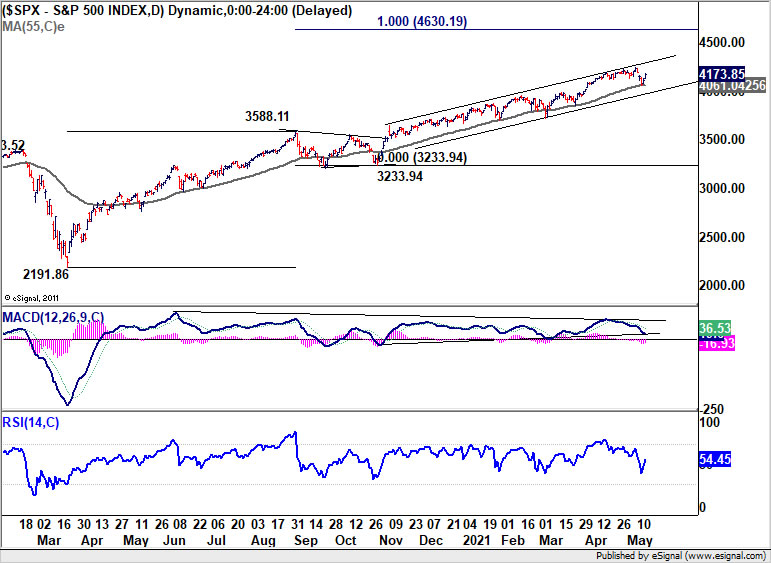
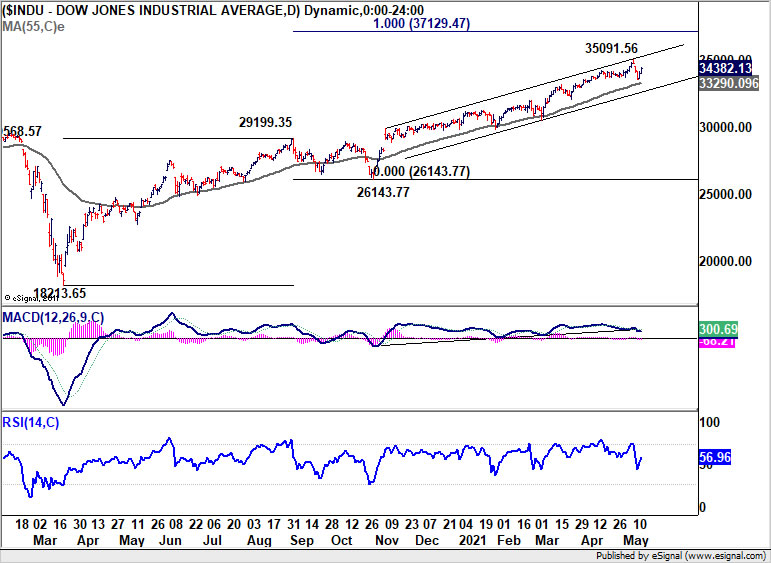
DOW and S&P 500 stay in up trend despite steep pull back
After initial pull back to 4056.88, S&P 500 drew notable support from 55 day EMA and recovered. It’s staying comfortably inside medium term channel support. Thus, the up trend not in threat for the moment. We’d continue to expect further rise to 100% projection of 2191.86 to 3588.11 from 3233.94 at 4630.19 in the medium term.
Similarly, DOW’s pull back was shallower than we originally expected, as 55 day EMA was not even though. The medium term up trend remains intact for next target of 100% projection of 18213.65 to 29199.35 from 26143.77 at 37129.47.
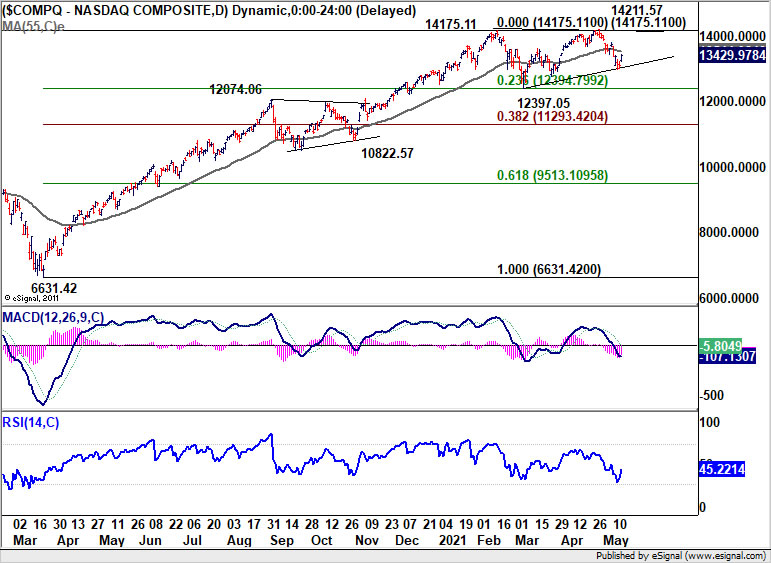
Even the underperforming NASDAQ was not too bad, as it was just extending the consolidation pattern from 14175.11 with another falling leg. Indeed, after Friday’s recovery, there is prospect that the falling leg from 14211.57 has completed. Break of 55 day EMA (now at 13544.98) this week would even argue that the up trend is ready to resume through 14211.57 high.
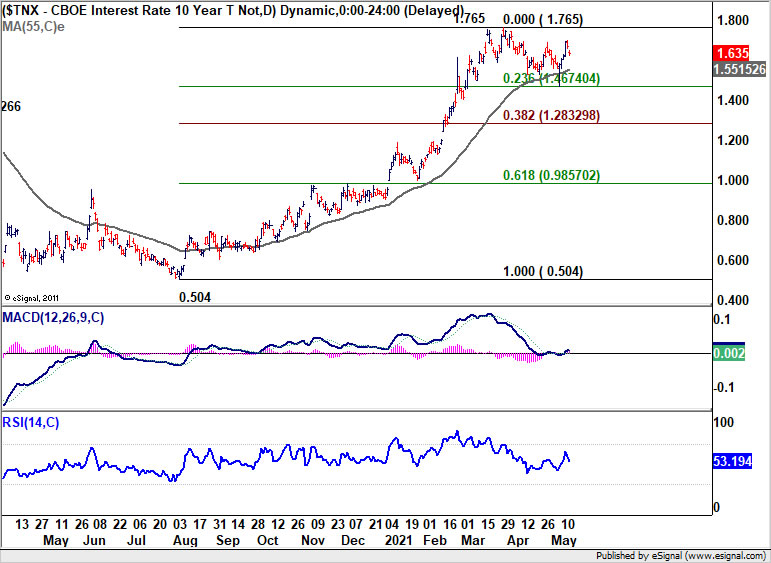
10-year yield failed upside breakout
The development in treasury yields was relatively calmer than originally expected. 10-year yield looked like it’s going to take out 1.765 high with Wednesday’s fierce surge. Yet, it quickly lost momentum and settle well in recent range. Consolidation from 1.765 is now more likely to extend further sideway. Though, the bottom of the rate should be set at 23.6% retracement of 0.504 to 1.765 at 1.467.
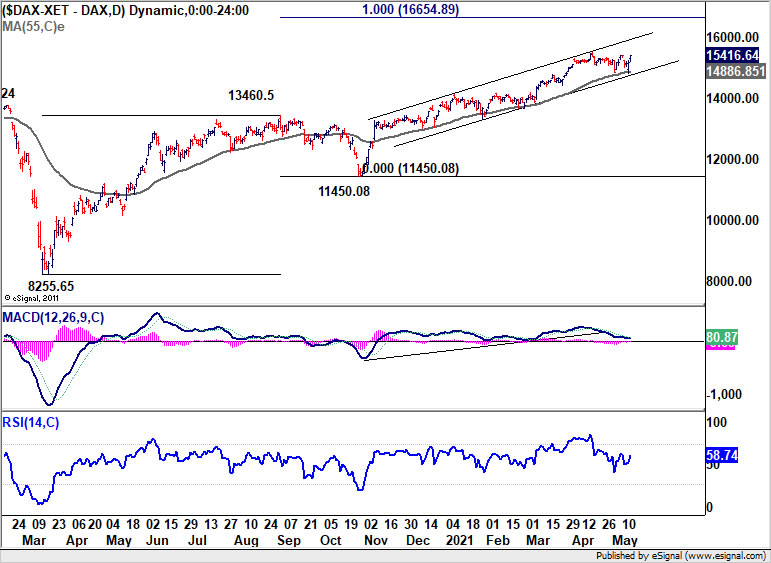
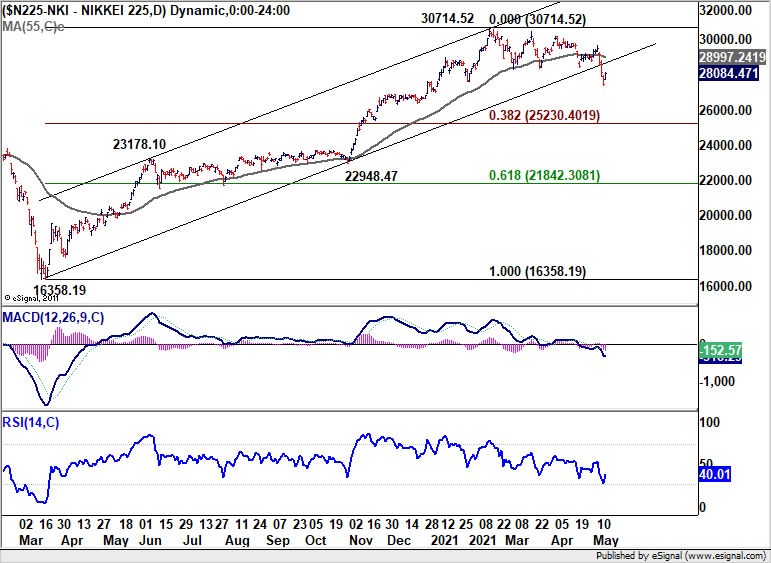
DAX stayed bullish, but Nikkei is uncertain
Developments in the global markets were mixed though. In Germany, DAX drew some notably support from 55 day EMA and rebounded. It’s also staying well inside medium term channel. Up trend from 8255.65 is still on healthy track towards 100% projection of 8255.65 to 13460.50 from 11450.08 at 16654.89.
However, Nikkei’s outlook, was much worse as the long term channel support was broken with last week’s correction. Focus now is on whether global developments could lift Nikkei back above 55 day EMA (now at 28997.24) quickly. Or, the correction from 30714.53 would extend further to 38.2% retracement of 16358.19 to 30714.52 at 25230.40 before completion. If the bearish case realizes, that might in turn be a drag on Asian, and other markets.
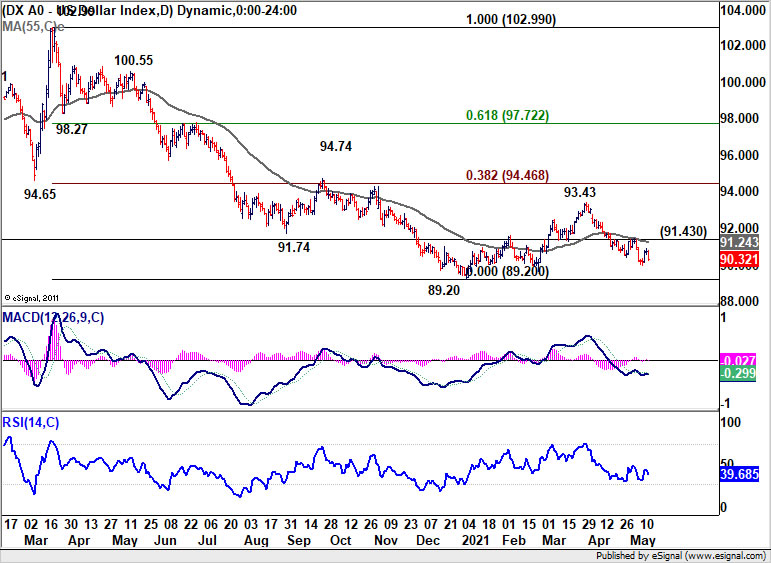
Dollar index losing some downside momentum as it approached 89.20
Dollar index’s decline from 93.43 continued last week but downside momentum has started to diminish as indicated by daily MACD. There is growing chance that such decline is merely the second leg of a consolidation pattern from 89.20. We’d pay attention to the momentum of the next fall as it approaches 89.20 low. Meanwhile, break of 91.43 resistance would argue that such consolidation pattern has started the third leg, towards 38.2% retracement of 102.99 to 89.20 at 94.46.
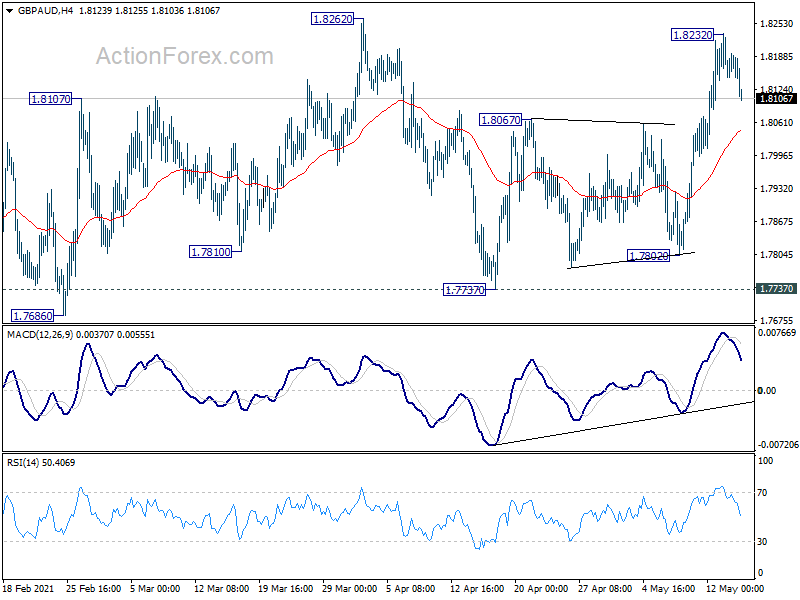
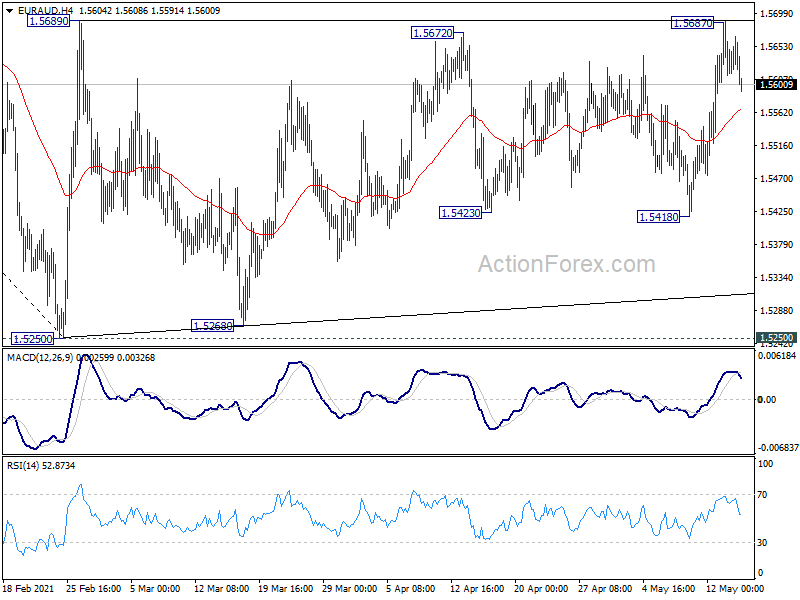
GBP/AUD and EUR/AUD rejected by near term resistance levels
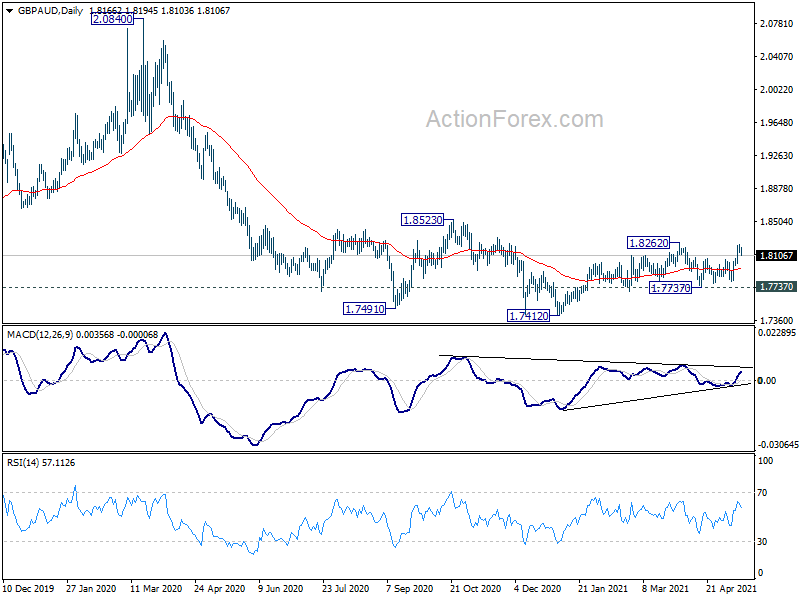
While Australian Dollar closed broadly lower last week, it’s performance was actually not disastrous. Even against the strongest Sterling, it held on to near term support levels. GBP/AUD was rejected below 1.8262 resistance, despite jumping to 1.8232. Focus this week is back on 1.8067 resistance turned support. Break there will suggest that rise from 1.7737 has completed. Recent range trading will continue, around flat 55 day EMA, inside range of 1.7737/8262.
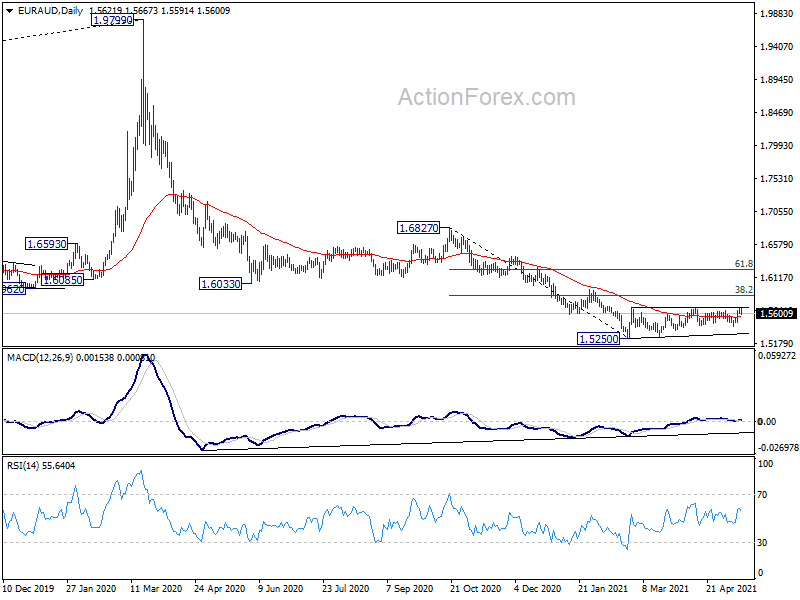
EUR/AUD’s rally was also limited by 1.5689 resistance, and it retreated notably after hitting 1.5687. Break of 4 hour 55 EMA (now at 1.5565) will extend the consolidation pattern from 1.5250 with another falling leg. Further, it’s just a matter of time when downside breakout through 1.5250, as down trend from 1.9799 resume, happens.
USD/CAD Weekly Outlook
USD/CAD edged lower to 1.2055 last week but quickly recovered. As upside was limited below 1.2265 resistance, initial bias remains neutral this week first. We’d continue be stay cautious on support from 1.2061 long term cluster support to bring reversal. . On the upside, break of 1.2265 support turned resistance will turn bias back to the upside for 1.2363/2653 resistance zone first. However, sustained break of 1.2061 will carry larger bearish implications. Next near term target will be 161.8% projection of 1.2880 to 1.2363 from 1.2653 at 1.1816.
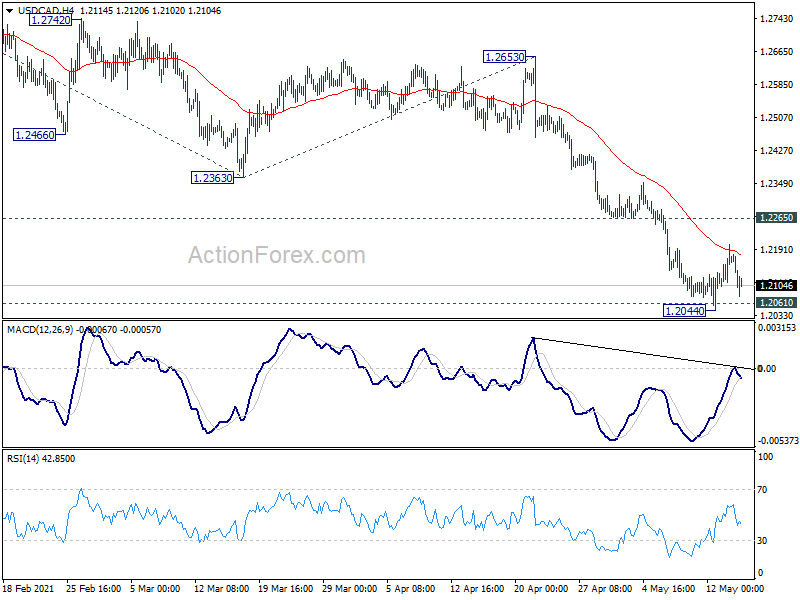
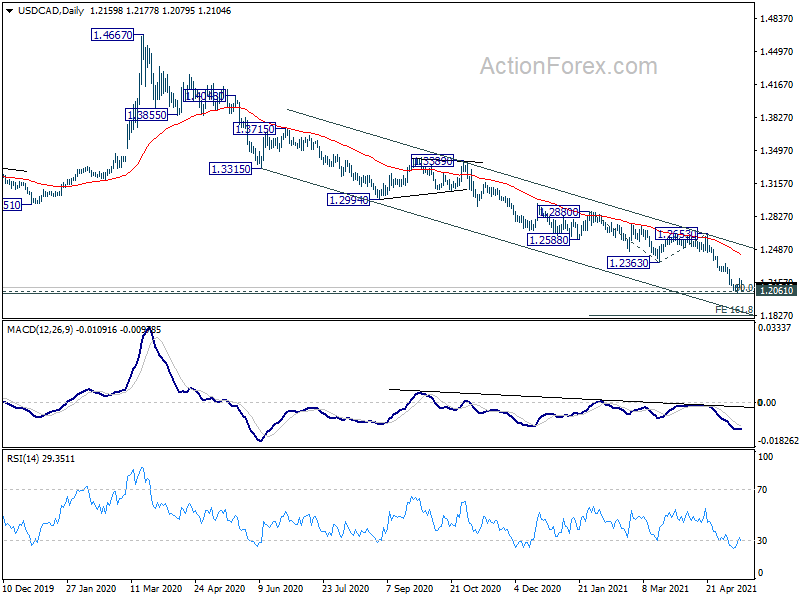
In the bigger picture, fall from 1.4667 is seen as the third leg of the corrective pattern from 1.4689 (2016 high). We’re look for strong support from 1.2061 (2017 low) and 50% retracement of 0.9406 to 1.4689 at 1.2048 to bring rebound. Nevertheless, sustained break of 1.2653 resistance is needed to be the first sign of medium term bottoming. Otherwise, outlook will remain bearish in case of strong rebound. Also, sustained break of 1.2061 will pave the way to 61.8% retracement of 0.9406 to 1.4689 at 1.1424.
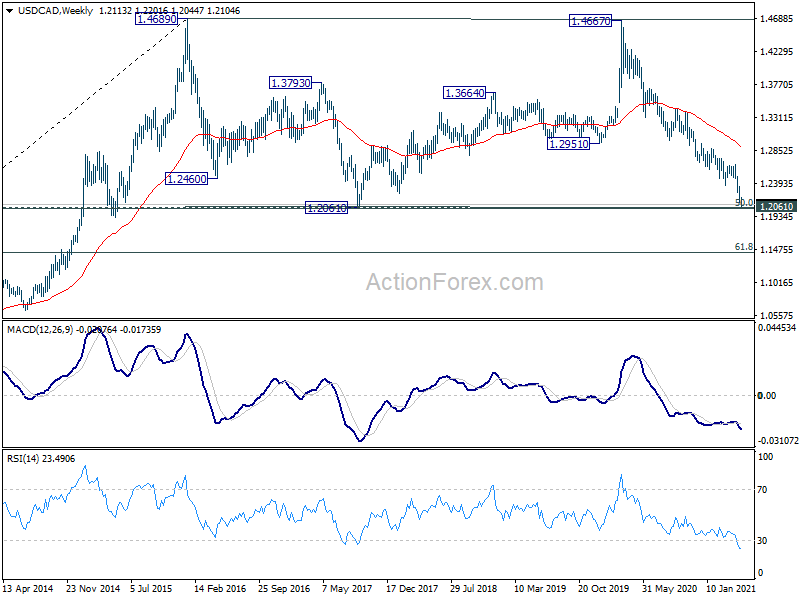
In the longer term picture, we’re viewing price actions from 1.4689 as a consolidation pattern. Thus, up trend from 0.9506 (2007 low) is still expected to resume at a later stay. This will remain the favored case as long as 1.2061 support holds, which is close to 50% retracement of 0.9406 to 1.4689 at 1.2048. However, sustained break of 1.2061 will be a sign of long term bearishness. Deeper fall would be seen to 61.8% retracement at 1.1424 and below.


