
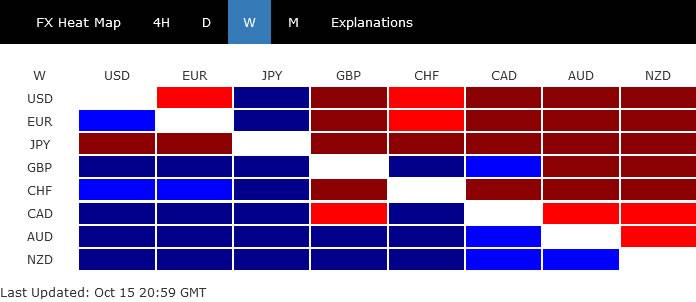
Yen’s selloff accelerated rather steeply last week, on the back of surging commodity and energy prices. Dollar was also pressured this time, as treasury yields retreated and on late rally in stocks. Euro was not to far away, as pressured by selloff in crosses. On the other hand, commodity currencies ended broadly higher, as led by Kiwi and Aussie. Sterling was also strong as aided by increasing speculations of an early BoE rate hike.
As noted before, US stock indexes are probably ready to resume their long term up trend. Industrial metal like copper could also be staging an upside breakout too. Such developments will continue to exert much downside pressure in Yen, while lifting commodity currencies. Dollar’s upside, however, could be capped as rise in yields loses momentum.
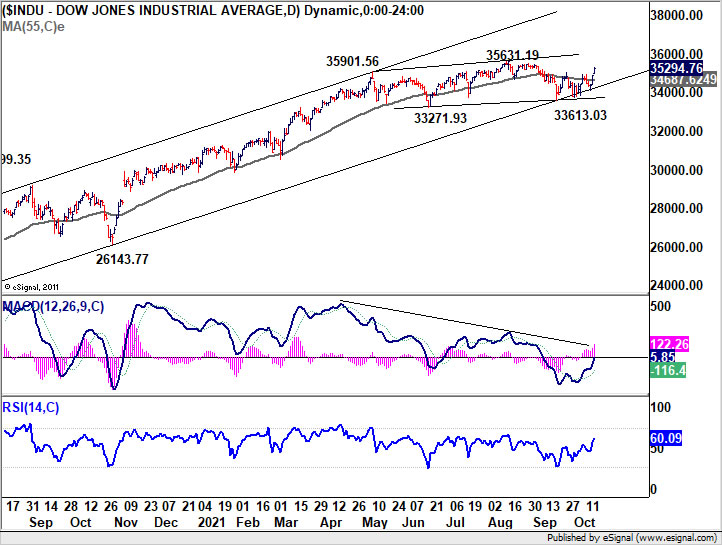
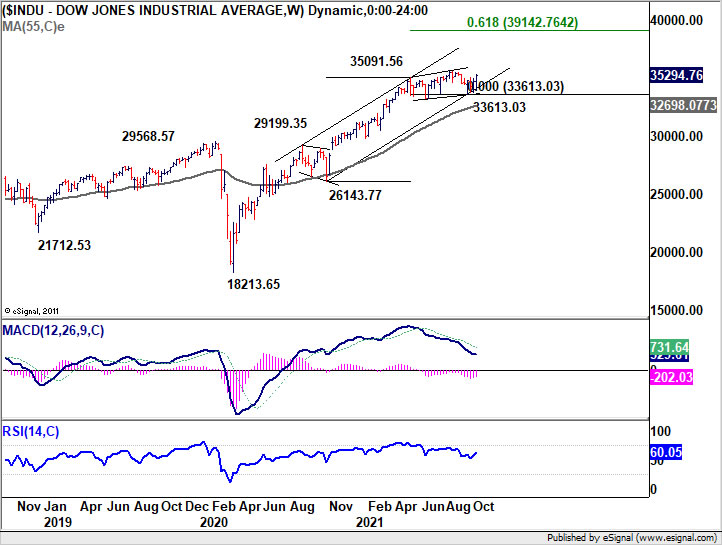
DOW ready to resume long term up trend through 35631 high
The late rally in DOW last week suggests that it has finally overcome the 55 day EMA with some conviction. We’re now viewing price actions from 35091.56 as a three wave consolidation pattern that should have completed at 33613.04, after hitting medium term channel support. That is, long term up trend from 18213.65 (2020 low) is probably ready to resume.
Retest of 35631.19 high should be seen rather soon. Sustained break there will confirm our bullish view. Next target will be 61.8% projection of 26143.77 to 35091.56 from 3361.03 at 39142.76. Such development could spark more explosive selloff in Yen.
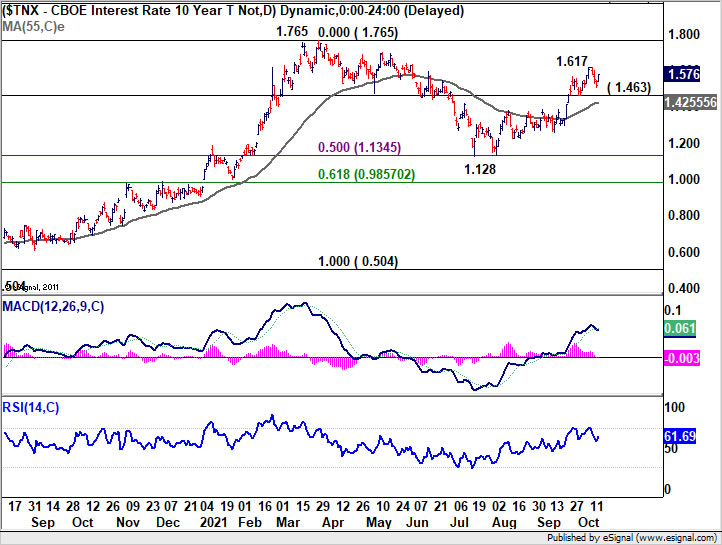
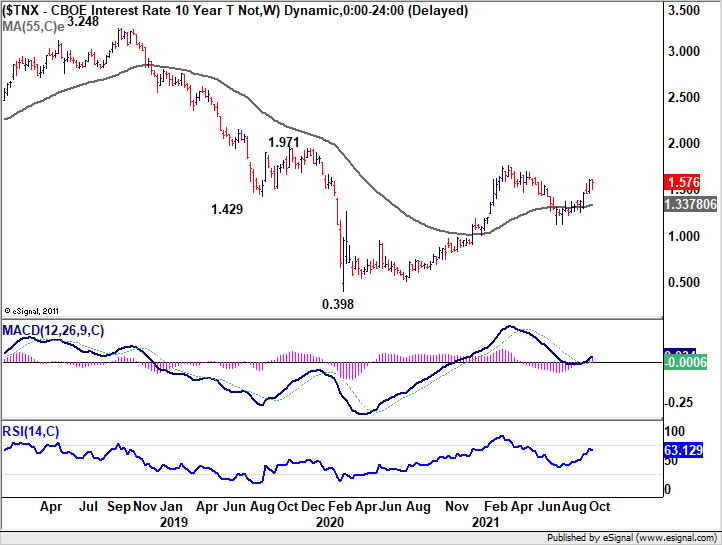
10-year yield still on track to retest 1.765 high, but no sign of breakthrough yet
10-year yield lost momentum after hitting 1.617 the prior week, and turned into consolidation last week. But there is no threat to the near term up trend for now, with 1.463 support intact. Further rise is still expected and break of 1.617 will target 1.765 high. For now, it’s unsure if TNX could surge through 1.765. Or, break of 1.1463 support will extend the corrective pattern from 1.765 with another falling leg. Dollar’s overall strength could be limited if stocks continue to rally but TNX is capped below 1.765.
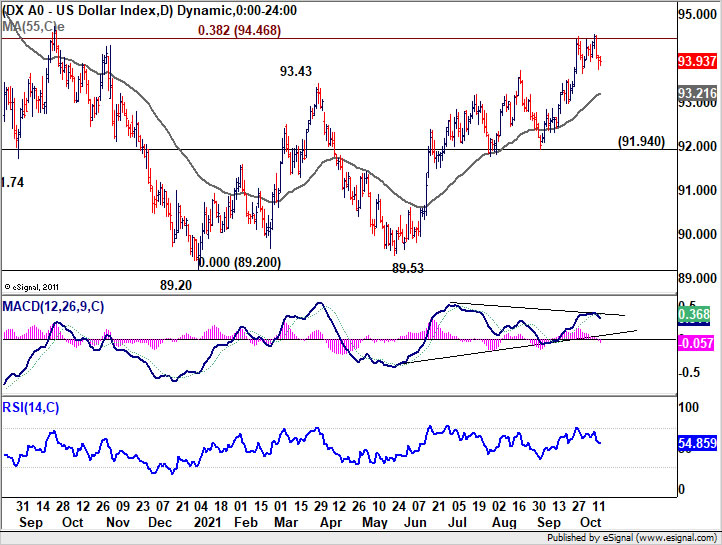
Bearish divergence in daily MACD suggests deeper pull back for Dollar index
Dollar index edged higher to 94.56 last week, but failed to sustain above 38.2% retracement of 102.99 to 89.20 at 94.46 again. The retreat from there is so far shallow, with help from weakness in Euro and Yen. But bearish divergence condition in daily MACD is raising the chance of a deeper pull back, or even reversal. On the downside, break 55 day EMA (now at 93.21) should confirm short term topping and bring deeper fall towards 91.94 support next.
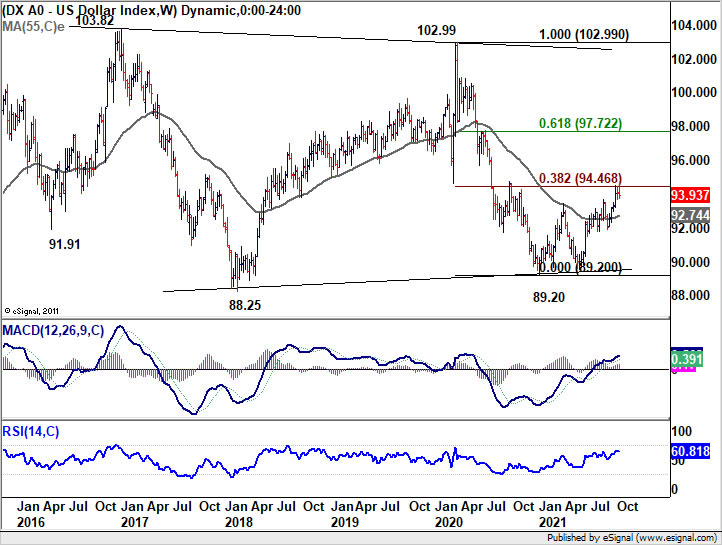
Nevertheless, sustained break of 94.46 carry larger bullish implication. That is, rise from 89.20 is already reversing the whole down trend from 102.99 (2020 high). In this case, stronger rally would be seen to 61.8% retracement of 97.72 and possibly above.
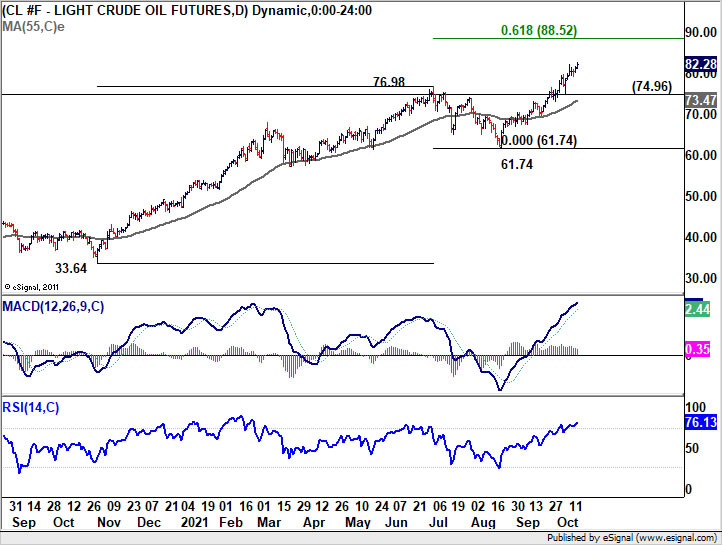
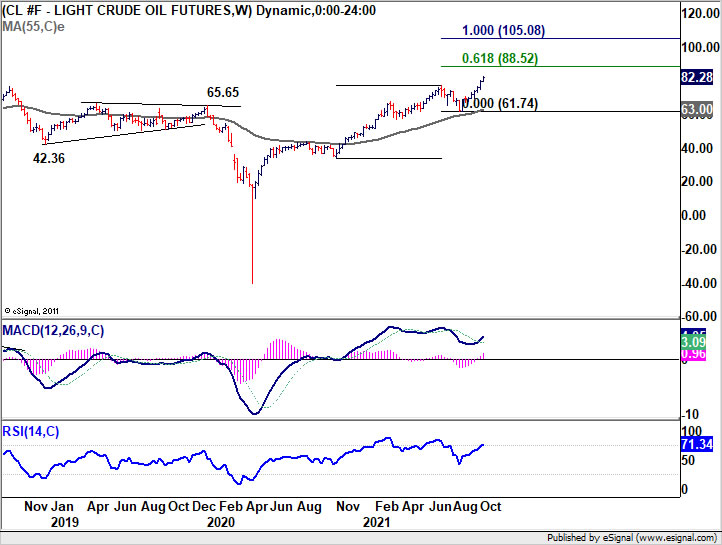
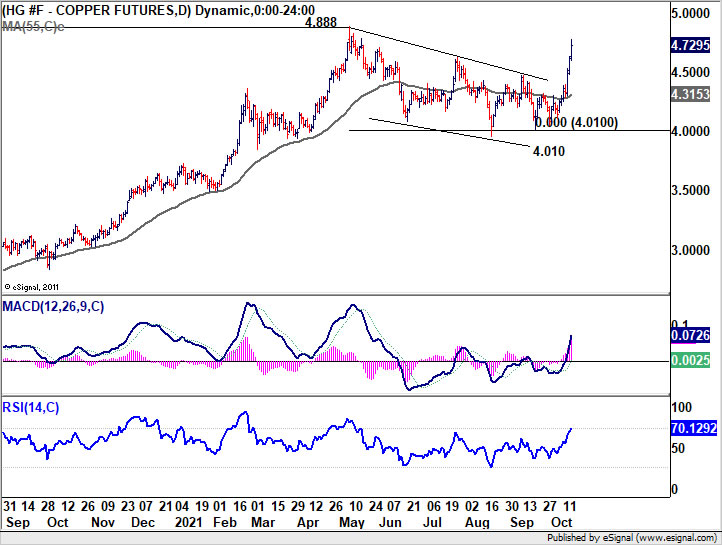
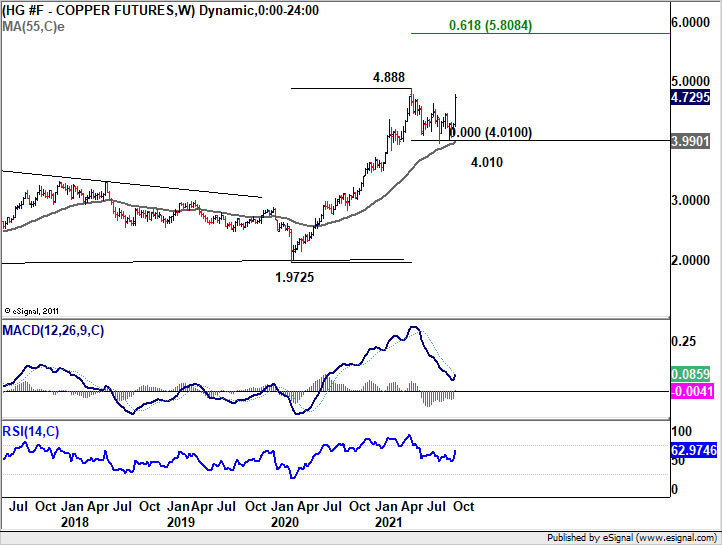
WTI oil extends up trend, copper to break out soon
The strong up trend in WTI crude oil continued last week, hitting as high as 82.66. Outlook will continue to stay bullish as long as 74.96 near term support holds. WTI should target 61.8% projection of 33.64 to 76.98 from 61.74 at 88.52 next.
Industrial metals are also catching up. Copper’s strong rally last week argues that the triangle consolidation from 4.888 has completed at 4.010 already, after drawing support from 55 week EMA. Based on current momentum, break of 4.888 high should be see rather soon. In that case, up trend from 1.9725 would resume and target 61.8% projection of 1.9725 to 4.888 from 4.010 at 5.808. Both development in oil and copper are not favorable for keeping inflation under control.
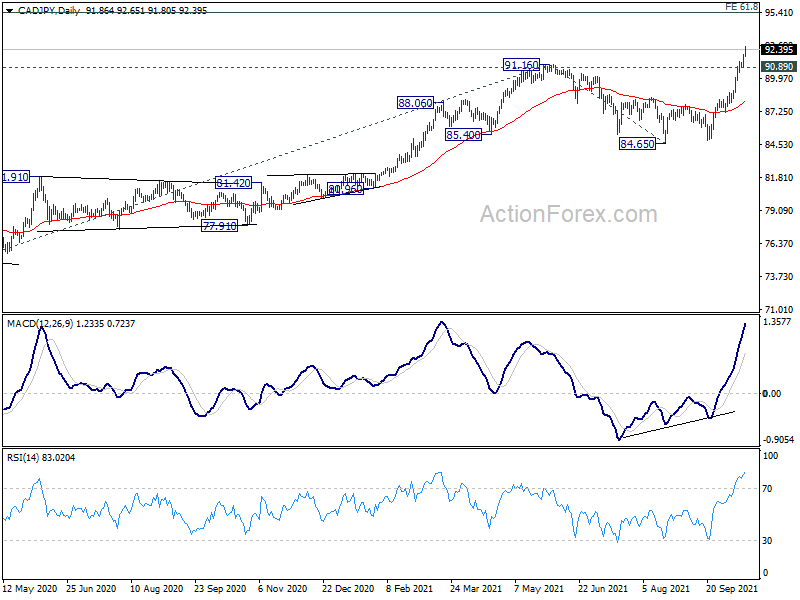
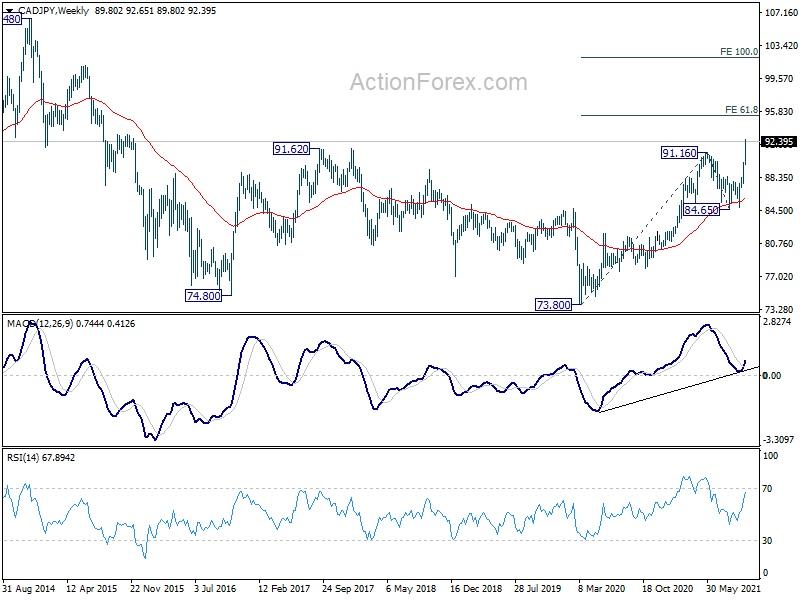
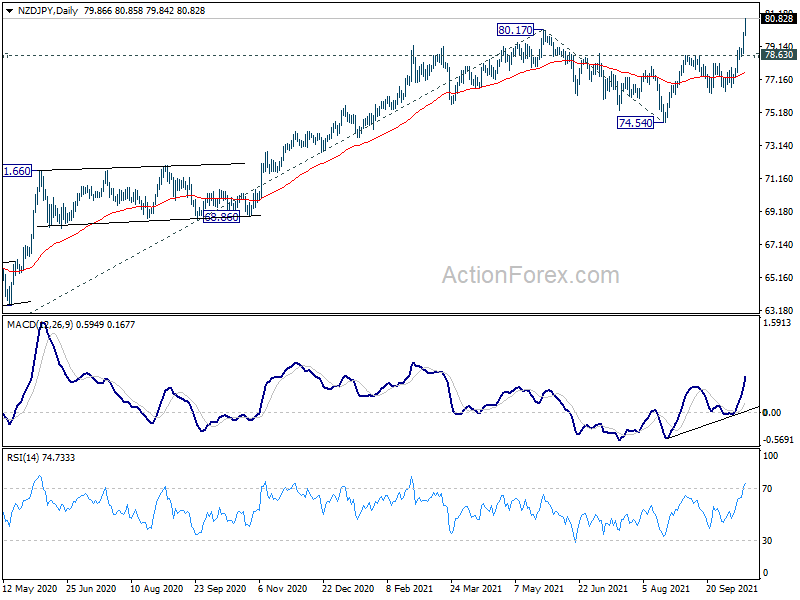
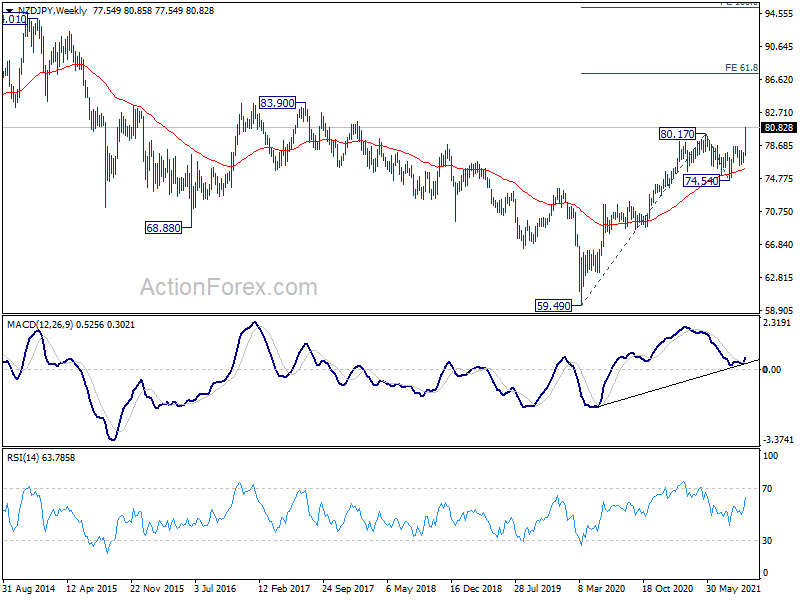
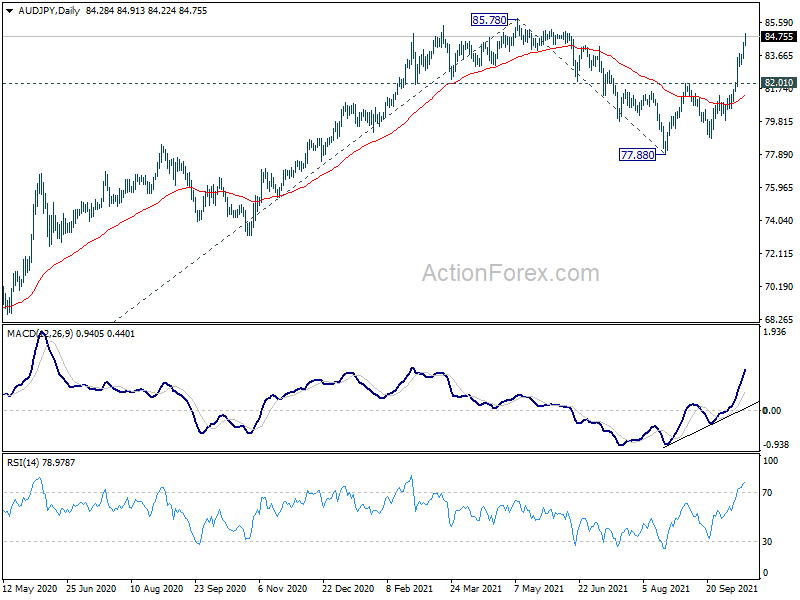
CAD/JPY and NZD/JPY upside breakout, AUD/JPY too follow soon
Commodity Yen crosses are clearly the top movers this month, on the back on surging commodity and energy prices, rising global treasury yields, and resistance in investor sentiment.
CAD/JPY powered through 91.16 high to resume whole up trend from 73.80 (2020 low). Indeed, the break of 91.62 long term resistance (2017 high) also suggest that the fall from 106.48 (2014 high) has completed with three waves down to 73.80. Near term outlook will now stay bullish as long as 90.89 support holds. Further rise should be seen to 61.8% projection of 73.80 to 91.16 from 84.65 at 95.37 next.
NZD/JPY followed by breaking through 80.17 high to resume the up trend from 59.49 (2020 low) too. Near term outlook will stays bullish as long as 78.63 support holds. Further rise should be seen to 83.90 resistance first. Firm break there will also confirm that fall from 94.01 (2014 high) has completed with three waves down to 59.49. NZD/JPY should then target 61.8% projection of 59.49 to 80.17 from 74.54 at 89.17 next.
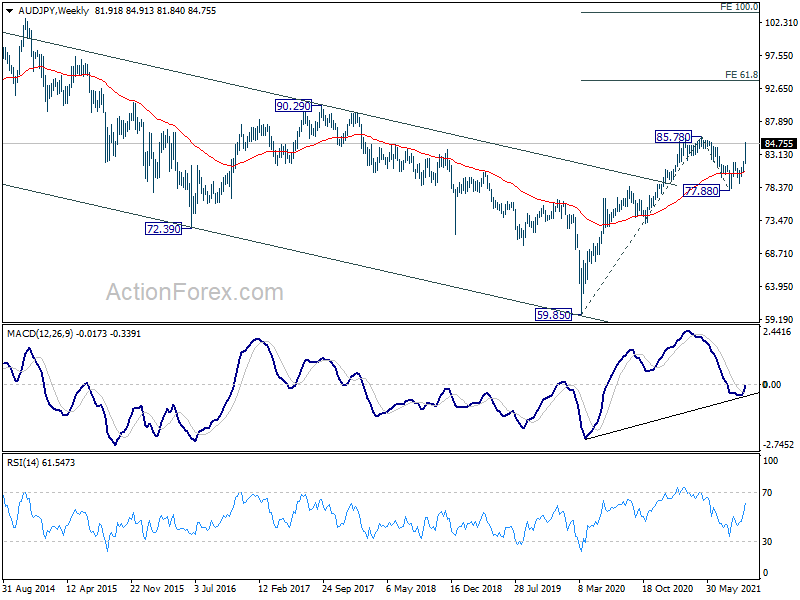
AUD/JPY continued to lag behind, but it’s nonetheless on track to follow CAD/JPY’ and NZD/JPY’s path, and should break through 85.78 high soon. In the case, up trend form 59.85 (2020 low) should resume for 90.29 long term resistance first. Sustained break there should confirm that whole decline from 105.42 (2013 high) has completed with three waves down to 59.85. Next target will be 61.8% projection of 59.85 to 85.78 from 77.88 at 93.90.
GBP/USD Weekly Outlook
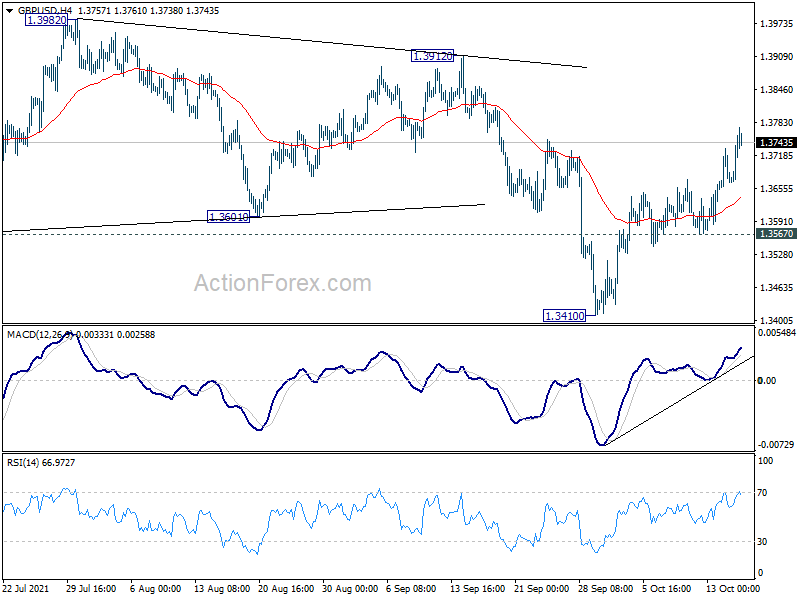
GBP/USD’s rebound from 1.3410 extended higher last week and broad 55 day EMA. Initial bias stays on the upside this week for 1.3912 key structural resistance. Firm break there will indicate that the correction from 1.4248 is complete with three waves down to 1.3410. Further rally would then be seen to retest 1.4248 high. On the downside, however, break of 1.3567 support will turn bias back to the downside for 1.3410 low instead.
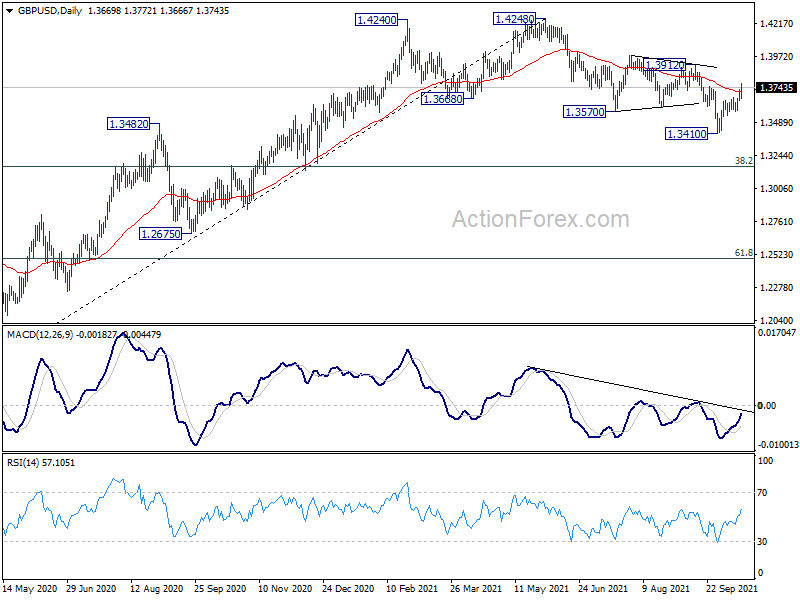
In the bigger picture, the structure of the fall from 1.4248 suggests that it’s a correction to the up trend from 1.1409 (2020 low) only. While deeper fall cannot be ruled out yet, downside should be contained by 38.2% retracement of 1.1409 to 1.4248 at 1.3164, at least on first attempt, to bring rebound. ON the upside, firm break of 1.4376 key resistance (2018 high) will add to the case of long term bullish reversal. However, sustained trading below 1.3164 will revive some medium term bearishness and target 61.8% retracement at 1.2493.
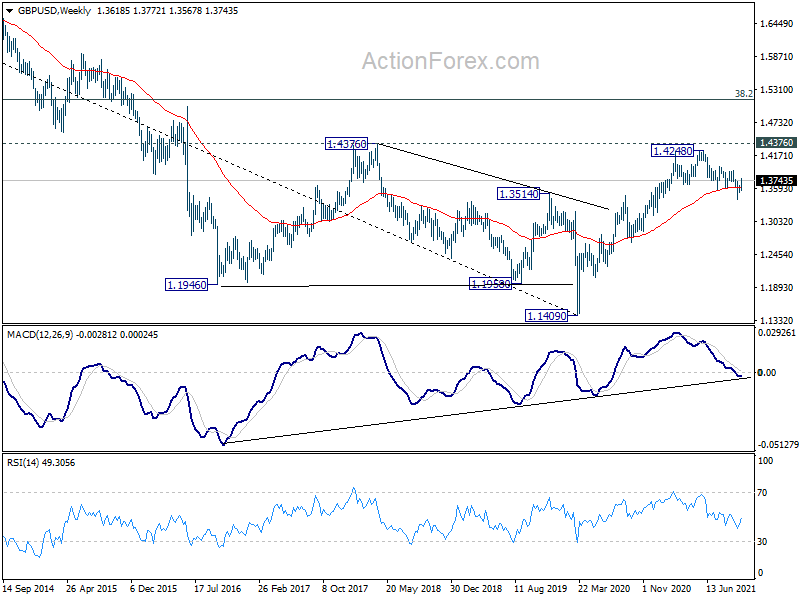
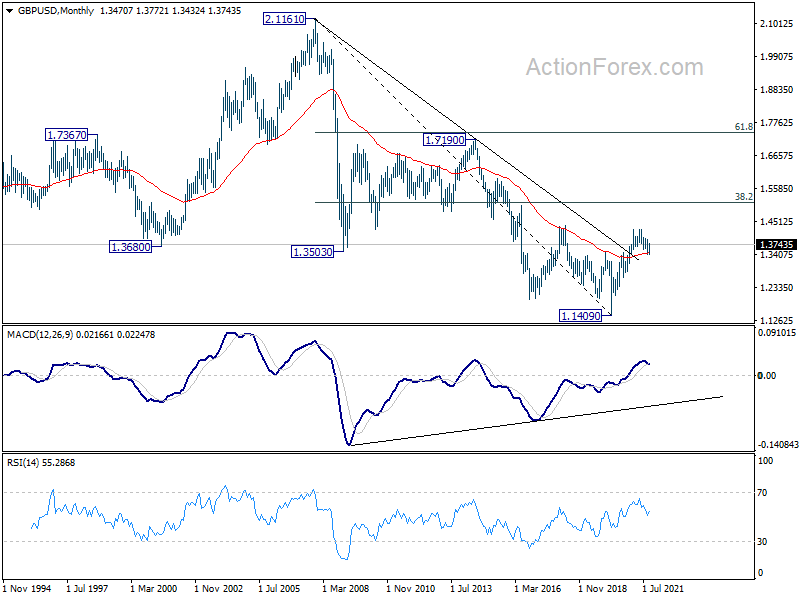
In the longer term picture, a long term bottom should be in place at 1.1409, on bullish convergence condition in monthly MACD. Rise from there would target 38.2% retracement of 2.1161 to 1.1409 at 1.5134. Reaction from there would reveal whether rise from 1.1409 is just a correction, or developing into a long term up trend.


