
The abrupt escalation in conflicts in the Middle East significantly influenced the global financial markets last week, causing capital influx into safe-haven assets. Amidst the military confrontations, Gold and other precious metals experienced a sharp surge in value. Oil prices also saw a rebound, reflecting the geopolitical tensions. While Treasury bonds reaped some advantages, equity markets, despite recording declines, managed to steer clear of any catastrophic plummets. These military tensions intertwined with ongoing adjustments in Fed rate expectations and persistent strong US inflation data, painting a complex picture for investors.
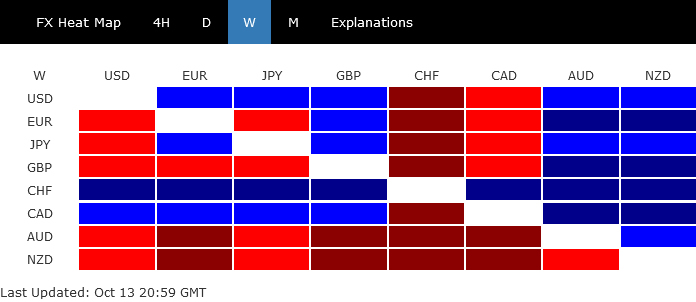
In the currency arena, Swiss Franc emerged as the frontrunner, buoyed by its recognized safe-haven status amidst geopolitical turmoil. Canadian Dollar secured the second spot, bolstered by the rebound in oil prices. US Dollar claimed the third position, underpinned by mild risk aversion in the stock markets and resilient treasury yields. Interestingly, Dollar managed to withstand the formidable rally in Gold, a testament to its inherent safe-haven appeal.
Conversely, New Zealand Dollar languished at the bottom of the performance chart, with Australian Dollar trailing closely. Sterling and Euro faced significant pressure, succumbing to accelerated selling against Swiss Franc following downside breakout. Yen, though mixed, found its descent cushioned by Japan’s looming threat of intervention.
As the global gaze remains fixed on the Middle East, the forthcoming market trajectory is poised to be significantly influenced by the potential of regional expansion or containment of the Israel-Hamas conflict. Although economic data retains its pivotal role in shaping market movements, its influence may be temporarily overshadowed by the unfolding geopolitical events.
Middle East Conflict Fuels Safe Haven Rush, Boosting Gold and Swiss Franc
Investors are fleeing to safe havens at the start of the week after the devastating attacks by Hamas militants to Southern Israel. Another round of massive safe haven flow was seen towards the end of the week, after Israel begun to retaliate. Driven by the escalating Middle East conflict, Gold price had their best week in seven months while Swiss Franc surges to the strongest level against Euro and Sterling in a year. There was also some lift to oil prices, as well as treasuries. If the geopolitical situation gets gloomier, there is a good chance that these safe haven assets will be boosted further.
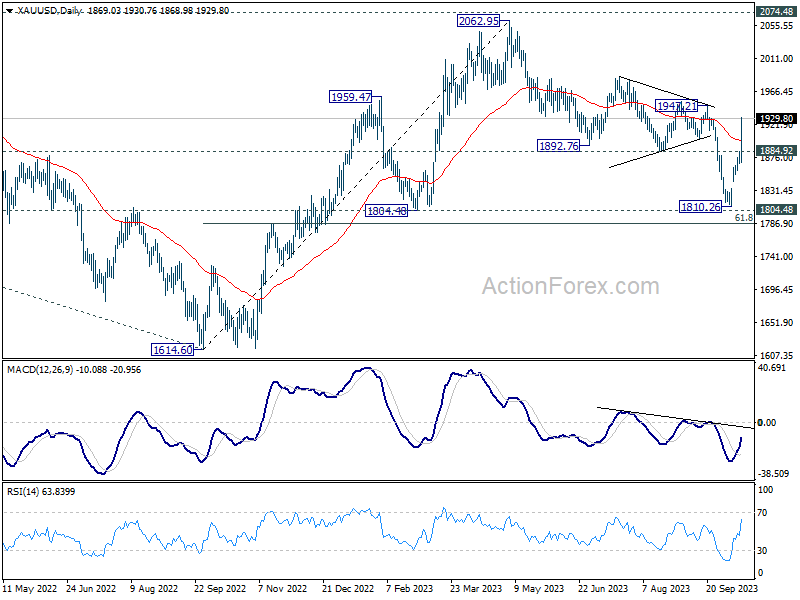
Technically, Gold’s strong rally and decisive break of 55 D EMA should confirm that corrective fall from 2062.95 has completed with three waves down to 1810.26, just ahead of 1804.48 structural support. Near term outlook will now stay bullish as long as 1884.92 support holds. Firm break of 1947.21 will pave the way to retest 2062.95 high.
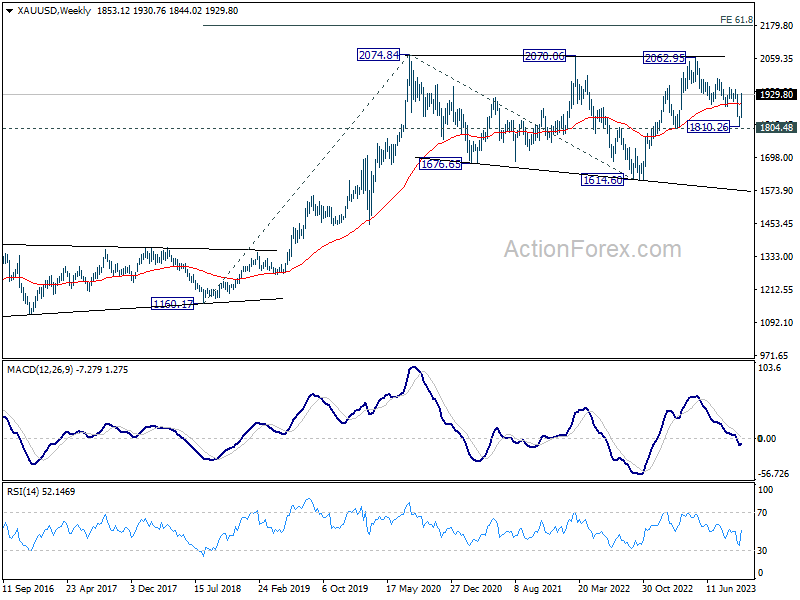
More importantly, in the bigger picture, current development, with fall from 2062.95 as a corrective move, argues that rise from 1614.60 (2022 low) is still in progress. This strengthens the case that long term corrective pattern from 2074.84 (2020 high) has completed with three waves down to 1614.60. It maybe early to confirm this bullish scenario, but it’s unsure how fast the geopolitical situation could deteriorate. Firm break of 2062.95/2074.84 resistance zone will set the stage to 61.8% projection of 1160.17 to 2074.84 from 1614.60 at 2179.86.
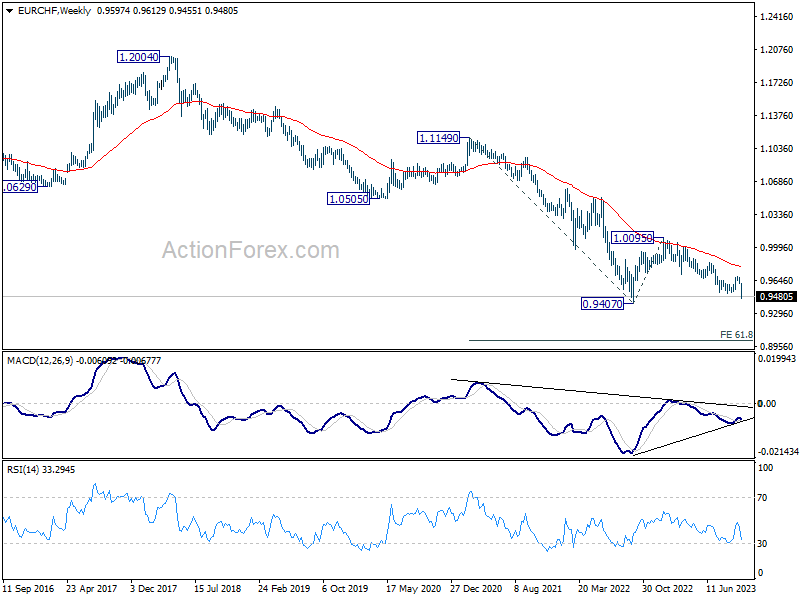
Swiss Franc was the strongest major currency last week, outshining both Canadian and Dollar. EUR/CHF break through 0.9513 support decisively to resume the down trend form 1.0095 (Jan high). Near term outlook will stay bearish as long as 0.9557 support turned resistance holds. Retest of 0.9407 (2022 low) should be seen next.
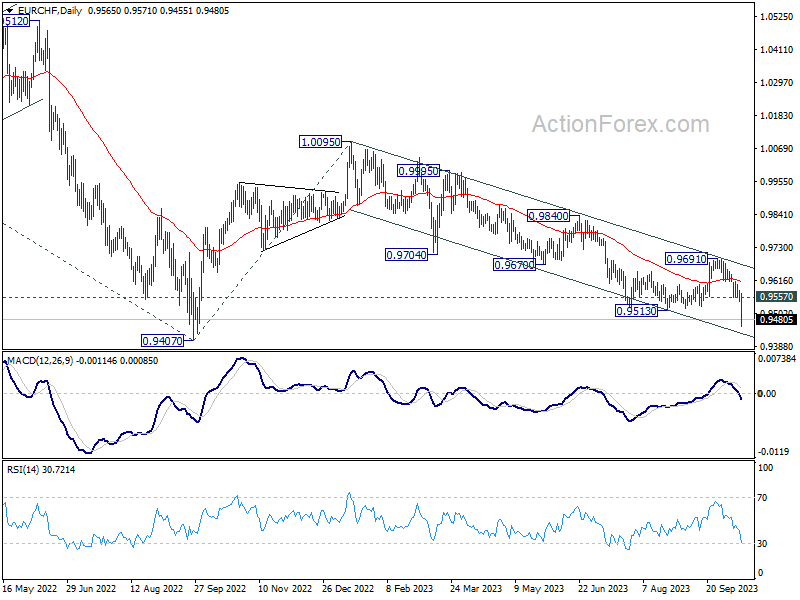
Also to be noted, firm break of the medium term lower channel support as well as 0.9407 could prompt downside acceleration in EUR/CHF, with simultaneous resumption of long term down trend. In this bearish case, 61.8% projection of 1.1149 to 0.9407 from 1.0095 at 0.9018 will be the next target.
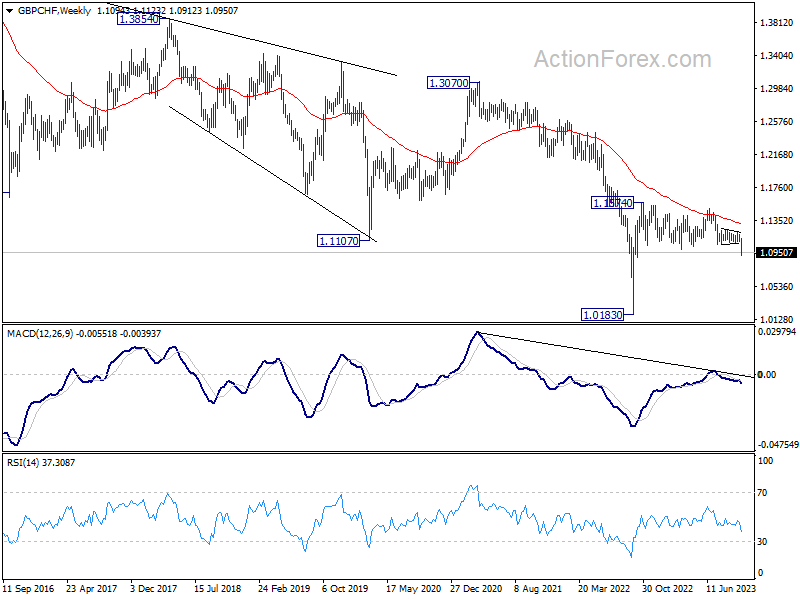
GBP/CHF also broke out, to the downside, from the year long range last week. Near term outlook will stay bearish as long as 1.1058 support turned resistance holds. Immediate focus is on 100% projection of 1.1574 to 1.0987 from 1.1502 at 1.0915. Sustained break there could prompt downside acceleration to 161.8% projection at 1.0552 next.
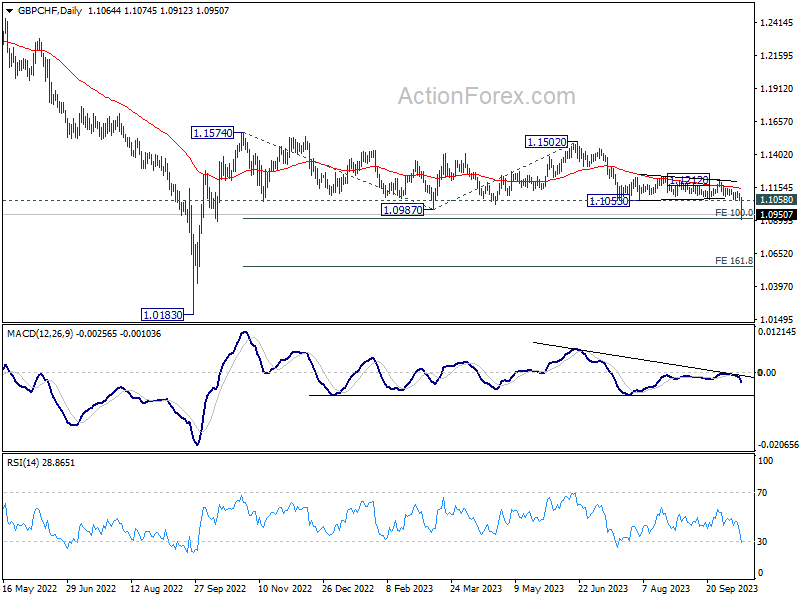
It’s still premature to conclude if GBP/CHF is ready for long term down trend resumption. But prior rejection by 55 W EMA is clearly a bearish sign. Attention with be on the downside momentum of the next move, to gauge the chance of revisiting 1.0183 (2022 low).
WTI Crude Oil Sees Notable Rebound; Supports Canadian Dollar
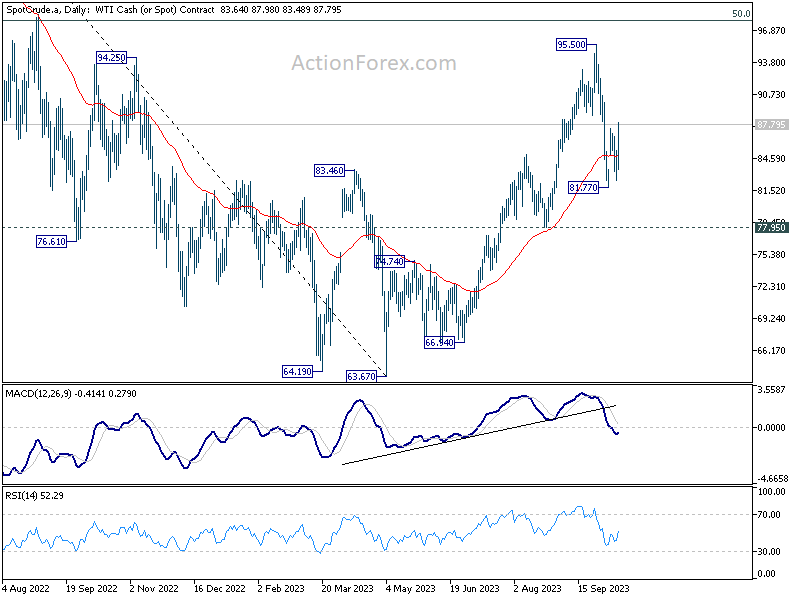
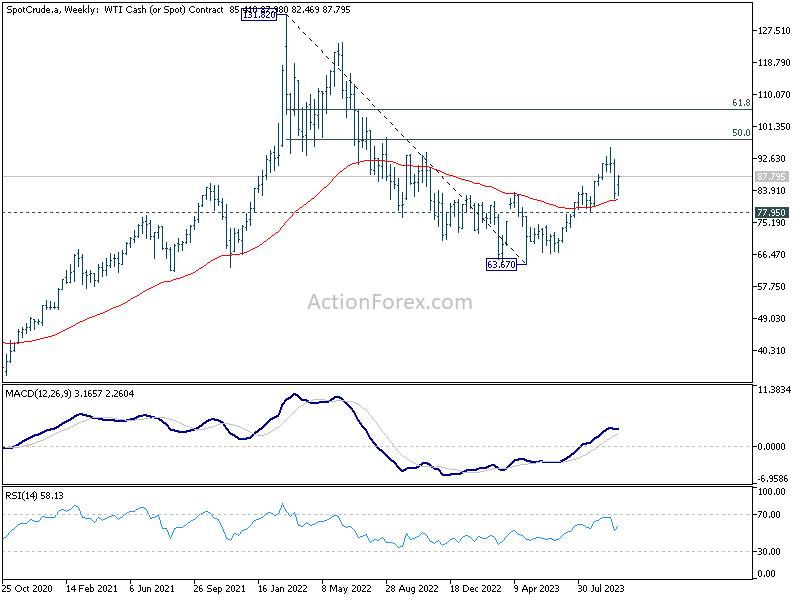
WTI crude oil exhibited a noteworthy recovery last week, showing resilience despite the more dominant surges observed in Gold and the Swiss Franc. The rebound ahead of 77.95 support is keeping rise from 63.67 alive. Thus, price actions from 95.50 is seen more of a consolidation pattern than trend reversal for now.
For the near term, further rally is in favor to retest 95.50. But even in case of a break there, the crucial resistance is at 50% retracement of 131.82 to 63.67 at 97.74. This resistance is not expected to be broken decisively in the near term considering weakening demand on global slowdown. So to conclude, WTI is now in a rising leg of a sideway pattern that should last for a while.
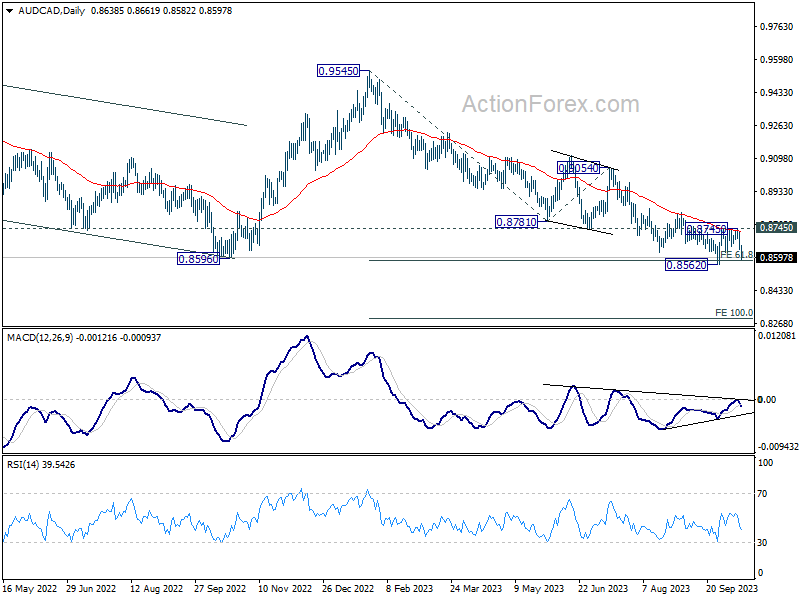
Parallel to these developments, Canadian Dollar received a bolstering impetus from the uptick in oil prices. AUD/CAD’s steep decline towards the end of the week indicates rejection by 55 D EMA (now at 0.8727). Immediate focus is now on 0.8562 support. Decisive break there will resume whole fall form 0.9545, as well as the down trend from 0.9991 (2021 high). Next target will be 100% projection of 0.9545 to 0.8781 from 0.9054 at 0.8290.
Complex Dynamics in US on Elevated Treasury Yields, Geopolitical Tensions and Sticky Inflation
The US financial markets are currently ensnared in a complex web of influencing factors. Fed officials have been increasingly vocal about the impact of soaring treasury yields, suggesting that their ascent could reduce the need for further monetary tightening. However, geopolitical upheavals have incited a flight to the relative safety of treasuries, exerting downward pressure on yields. Amidst these opposing forces, robust headline CPI data serves as a stark reminder that the battle against inflation remains in full swing. Despite these challenges, the absence of a large-scale exodus from equities underscores the resilience in investor sentiment.
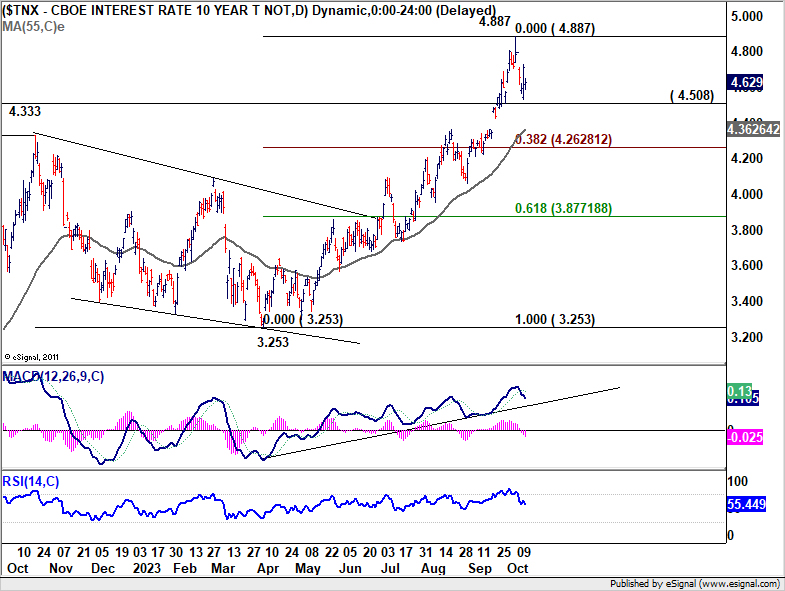
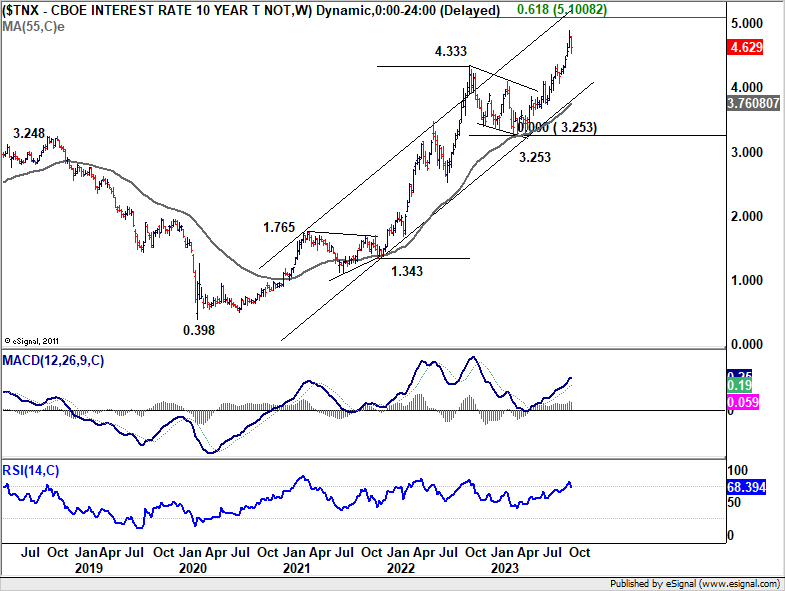
10-year yield fell to as low as 4.532 last week before stabilizing. With 4.508 support intact, price actions from 4.887 short term top is more likely a sideway consolidation pattern with range set between 4.5 and 4.9. More sideway trading could be seen in the near term, probably until FOMC meeting on November 1. Upside breakout is likely thereafter, subject to Fed’s guidance, as well as next batch of non-farm payroll and CPI data. However, firm break of 4.508 will argue that it’s already in correction to whole rise from 3.253. Deeper fall would then be seen to 38.2% retracement of 3.253 to 4.887 at 4.262.
NASDAQ reversed after climbing to 13714.13 last week to close the week slightly down at 13407.23. As the index is still staying well inside the near term falling channel, corrective fall from 14465.55 might still extend lower. But in that case, strong support could be seen from 38.2% retracement of 10088.82 to 14446.55 at 12781.89 to contain downside to complete the correction. Break above 13714.13 will resume the near term rise to retest 14446.55 high.
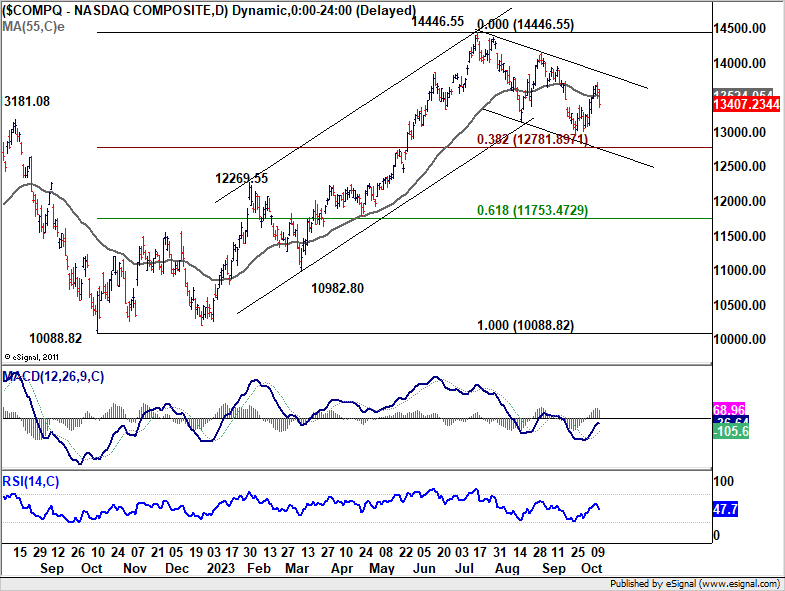
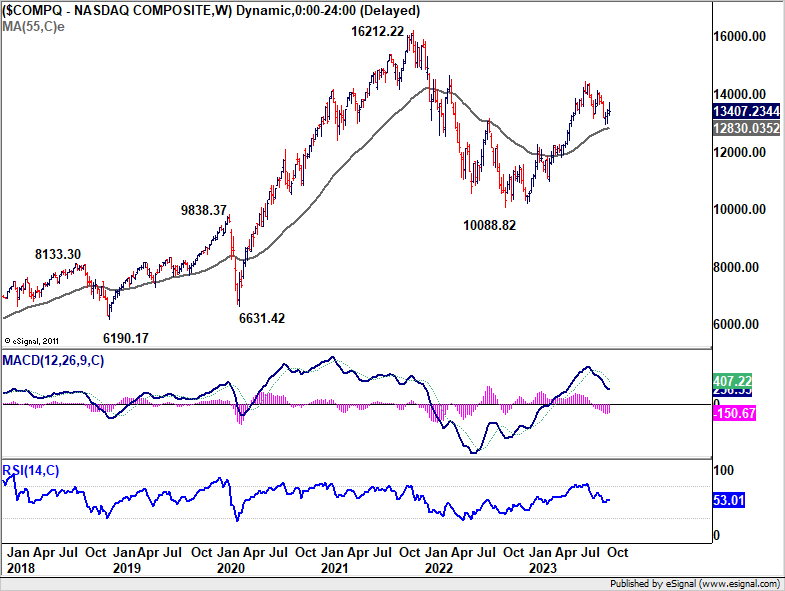
However, sustained trading below 12781.9 will argue that whole rise from 10088.82 has finished, and bring deeper fall to 61.8% retracement of 11753.47 and below , as the third leg of the pattern from 16212.22 (2020 high).
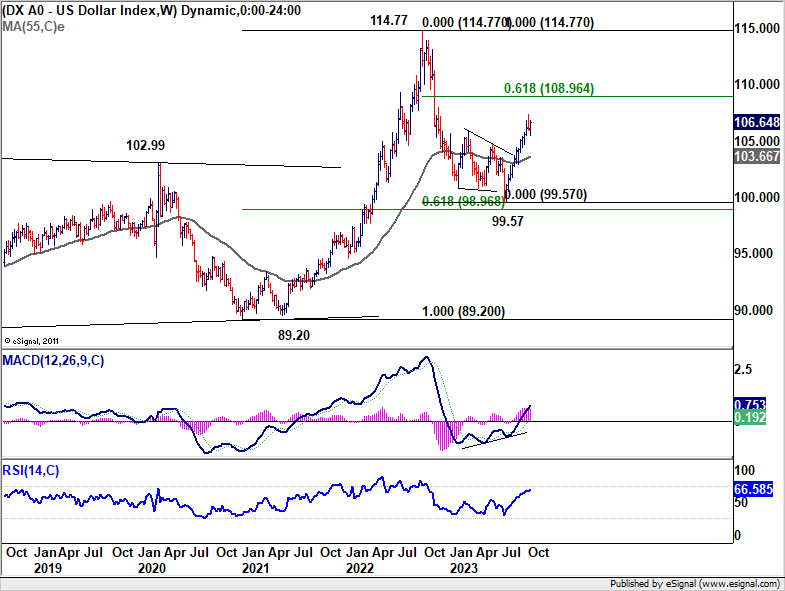
Dollar Index rebounded after breaching 105.65 support briefly. Even so, a short term top is likely formed at 107.34, and more corrective trading could be seen in the near term In case of another fall, down side should be contained by 38.2% retracement of 99.57 to 107.34 at 104.37 to bring rebound. On the other hand, above 107.34 will resume the rise from 99.57 to 61.8% retracement of 114.77 to 99.57 at 108.96.
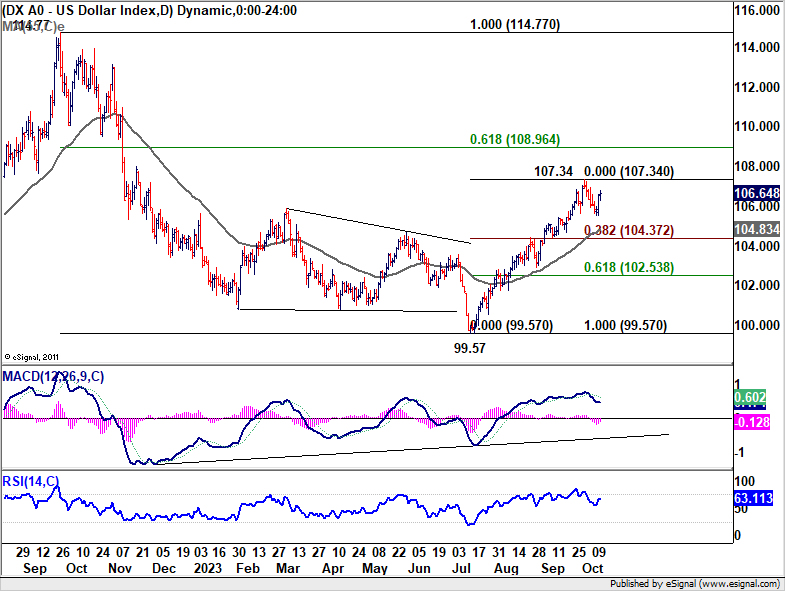
To reiterate the previous view, rise from 99.57 is seen as reversing the whole down trend from 114.77. However, to have Dollar Index breaking through to 108.96 decisively and have enough momentum to challenge 114.77, extended stock market selloff or rise in benchmark yields, or even both together, would be needed.
AUD/USD Weekly Report
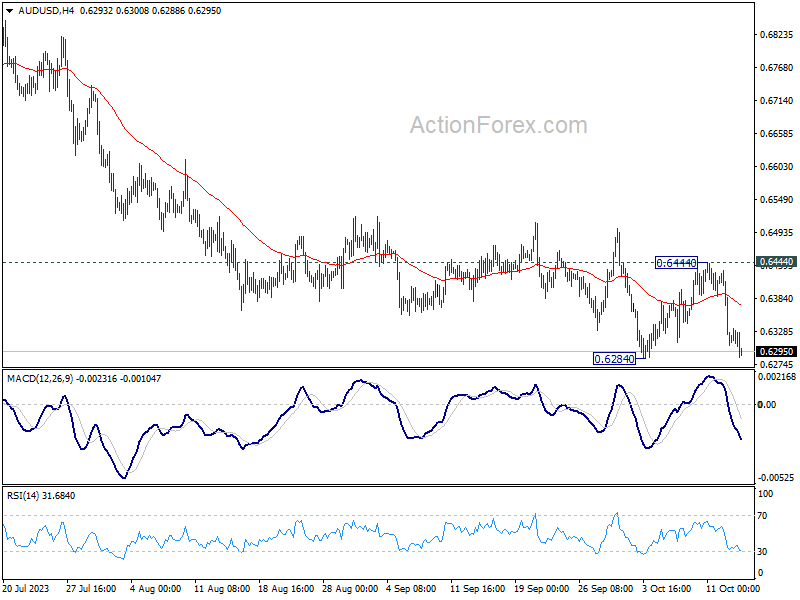
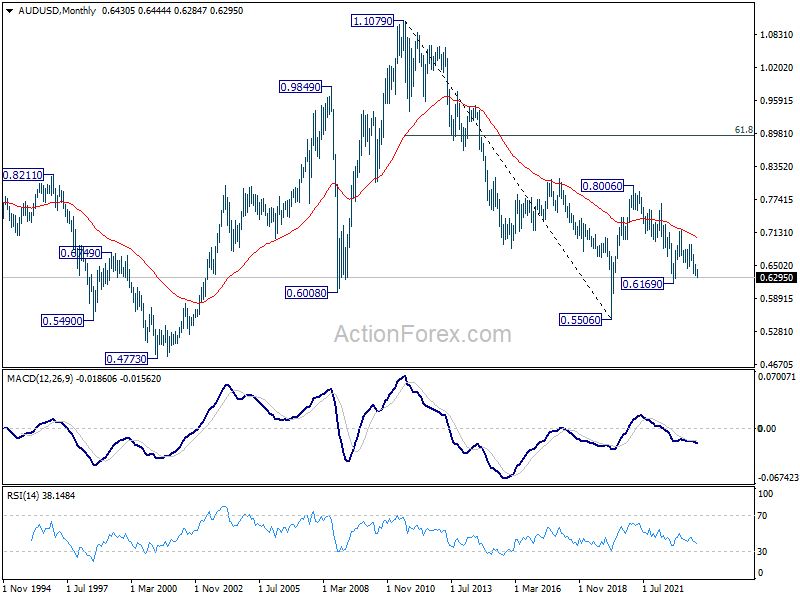
With the late decline last week, AUD/USD’s recovery from 0.6284 should have completed at 0.6444 already. Decisive break of 0.6284 this week will resume whole fall from 0.7156. Next target is 100% projection of 0.7156 to 0.6457 from 0.6894 at 0.6195, which is close to 0.6169 medium term support. For now, outlook will stay bearish as long as 0.6444 resistance holds, in case of recovery.
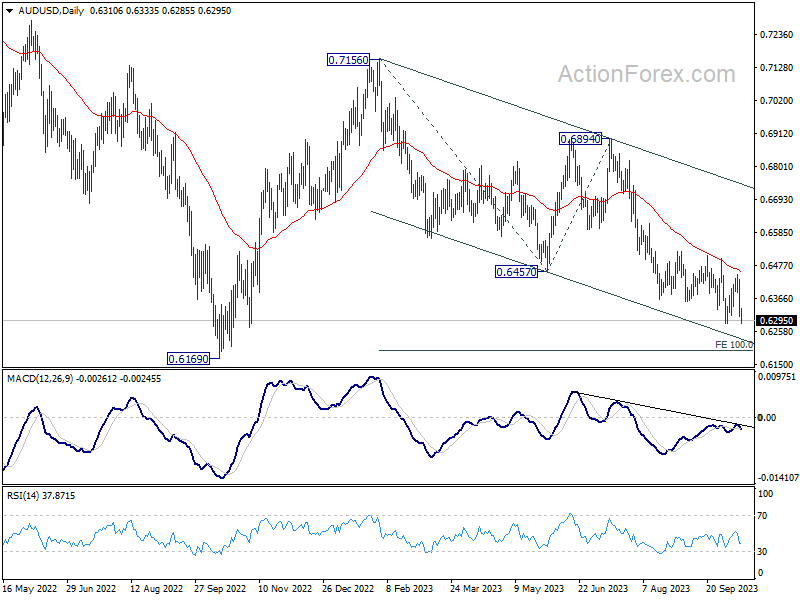
In the bigger picture, down trend from 0.8006 (2021 high) is possibly still in progress. Decisive break of 0.6169 will target 61.8% projection of 0.8006 to 0.6169 to 0.7156 at 0.6021. This will now remain the favored case as long as 0.6894, in case of strong rebound.
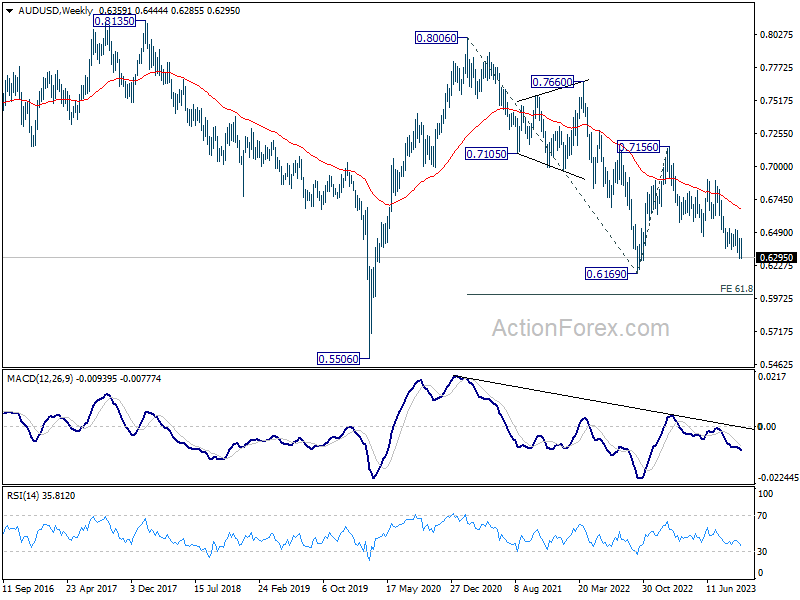
In the long term picture, while fall from 0.8006 might extend lower, the structure argues that it’s merely a correction to rise from 0.5506 (2020 low). In case of downside extension, strong support should emerge above 0.5506 to bring reversal. But still, momentum of the next move will be monitored to adjust the assessment.


