


TL;DR: Markets now price a 71.2% probability of a September RBA hike, with every cited forecaster expecting another increase and disagreeing only on timing — a relative-rate shift that lines up with AUD/NZD’s breakout above 1.2283.
The RBA Debate Is Now About September or November
A September RBA hike was still a minority economist call only a week ago. Markets now put the probability at 71.2%, while every forecaster cited here expects another increase and is arguing mainly over whether it comes on September 29 or in November. The important shift is therefore not which meeting wins. It’s that the debate has converged on another hike.
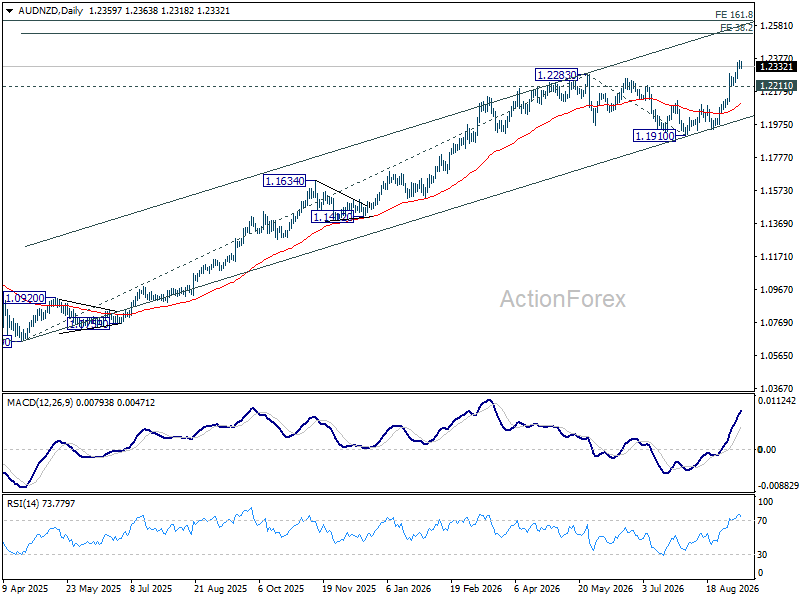
AUD/NZD has made its own move at almost exactly the same time. The cross broke decisively through 1.2283, the May high, and resumed its longer-term advance. The chart can’t tell us that RBA repricing caused the breakout, but the move is consistent with a clear relative-rate shift: expectations for Australian tightening have been revised higher while markets remain reluctant to extend the RBNZ’s latest hike into an equally aggressive path for New Zealand.
Hauser Put Inflation Back at the Center
RBA Deputy Governor Andrew Hauser gave markets the clearest reason to reassess the path in his ABC 7.30 interview on Tuesday. “We have one big problem, and that’s inflation,” he said, adding that inflation has stayed above target long enough that the Board will eventually have to decide “that is long enough.”
His warning that the RBA could raise rates sharply “tomorrow” sounded dramatic, but the context matters. Hauser was explaining what the Bank could do if it placed much less weight on full employment, not announcing an imminent shock tightening. He also explained why policy has moved more gradually: “The reason as a board we have decided to take it slowly is to preserve as many jobs in this country as we could.” The message wasn’t that the RBA suddenly wants aggressive tightening. It was that patience with above-target inflation isn’t unlimited.
RBA Assistant Governor Sarah Hunter reinforced that message by highlighting domestic inflation pressure in services, rents, and construction, as well as higher oil prices. Her reference to crude above $90 has already been overtaken by Brent above $100. That doesn’t mechanically strengthen the case for a September move, but it makes the persistence and pass-through of the energy shock more important to the inflation outlook.
Economists Have Moved Toward the Same Destination
The forecaster changes show how much the debate has narrowed.
Goldman Sachs economist Andrew Boak now favors September after previously assigning it only a 45% probability and leaning toward November. His explanation directly links the two forces driving this week’s repricing: “[The] hawkish commentary, together with our commodity team’s upgraded oil price forecasts, now makes September the most likely timing in our view.” Macquarie economist Ric Deverell also prefers September. His argument is that the 75bp of tightening delivered this year is slowing activity, but the labor market still points to limited spare capacity.
Westpac Chief Economist Luci Ellis and RBC economist Robert Thompson reach the same destination but prefer November, largely because they want stronger inflation confirmation. Ellis has warned against “overreacting to a noisy monthly” inflation print, while Thompson places greater weight on quarterly inflation data.
That’s the distinction worth preserving. Goldman and Macquarie are arguing for September. Westpac and RBC are arguing for November. None of the cited forecasters is arguing that the RBA is finished.
Oil Is Only Half the Inflation Story
Brent above $100 provides the obvious external pressure. The renewed Iran conflict has lifted energy costs, with Australian petrol prices approaching $2.10 a litre and diesel above $2.50. If those costs persist, they can work through transport, production, and household expenses rather than remaining an isolated commodity move.
But Australia also has a separate domestic capacity problem. AI-related datacentre investment is adding demand to a construction sector already trying to deliver housing and infrastructure with limited labor and material capacity. That’s not the same inflation mechanism as oil — one is an imported cost shock, the other is domestic demand pressing against supply constraints.
Weak productivity makes the combination more difficult. Without stronger productivity growth, the economy has less scope to absorb additional demand without generating price pressure. That helps explain why hawkish RBA rhetoric can coexist with weak sentiment surveys: consumers may feel strained, but that doesn’t necessarily mean economy-wide inflation pressure has disappeared.
The Market Is Pricing More Than One Move
The September numbers are now difficult to dismiss. Markets assign a 71.2% probability to a 25bp hike from 4.35% to 4.60%. That produces an implied post-meeting rate of around 4.53%, which simply represents the probability-weighted average of hike and hold outcomes.
More interestingly, the curve keeps tightening beyond September. By November 2, markets price roughly 1.18 cumulative hikes. By December 7, that reaches about 1.48. The path then extends gradually toward around 2.1 cumulative hikes by August 2027.
So the market isn’t merely betting the RBA might squeeze in one final move. It’s allowing for a measured extension of the tightening cycle.
ActionForex’s Technical View on AUD/NZD: Finally Clearing 1.2283
The AUD/NZD chart fits that relative-policy shift unusually well. The pair spent months below 1.2283, the May high, before breaking through it this week. Price is now around 1.23, with daily MACD accelerating strongly above zero and RSI at approximately 73.78. That’s a powerful breakout configuration, but the daily chart is also clearly overbought, so some consolidation would be entirely consistent with the bullish structure.
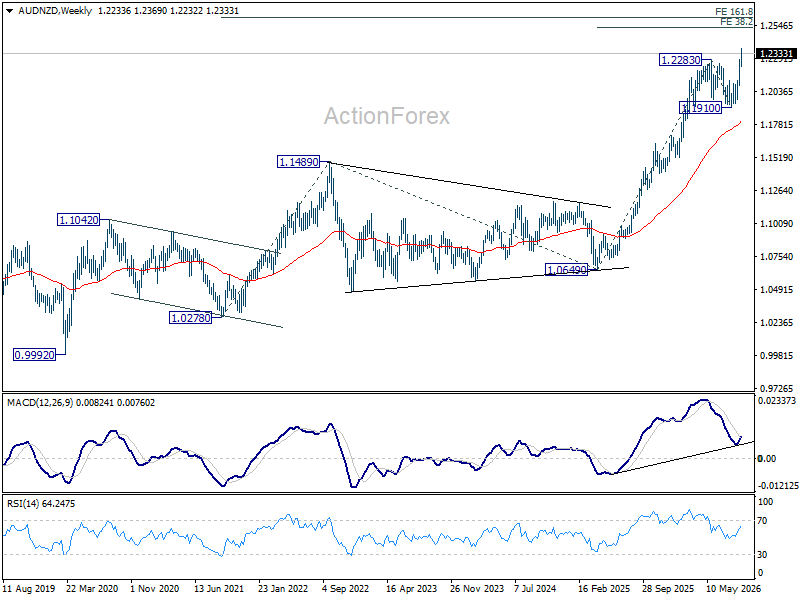
The weekly picture gives the move more room. Weekly RSI is around 64.25, well below the daily reading, while weekly MACD has turned higher again above zero. That suggests a short-term pause would be better viewed as a timeframe issue than immediate evidence the broader trend has exhausted itself.
The key near-term support is 1.2211. As long as it holds, the breakout remains intact. A break below would risk a deeper retreat toward the rising 55-day EMA before the larger uptrend can attempt to resume.
The Next Zone Is 1.2534–1.2608
Above current levels, the chart has two closely aligned projection targets. The first is 1.2534, the 38.2% projection of the 1.0649–1.2283 rise measured from 1.1910. The second is 1.2608, the 161.8% projection of the 1.0278–1.1489 advance measured from 1.0649. That makes 1.2534–1.2608 the next major upside zone.
There’s also a reason to treat it with respect. Under the current wave count, the rise from 1.0649 is the fifth wave of the entire advance from the 0.9992 low established in 2020. Momentum remains firmly bullish, but the larger structure could become mature as the pair moves toward those projections.
That creates the same balance seen in the RBA debate itself. The direction is clearer than it was a week ago, but the path still matters. Markets have moved decisively toward another RBA hike, while AUD/NZD has broken out in a way consistent with that relative-rate repricing. As long as 1.2211 holds, the next question is how much of that shift can carry the cross toward 1.2534–1.2608 before the increasingly mature uptrend demands a larger pause.
Key Takeaways
- Markets now price a 71.2% probability of a September RBA hike, up sharply from a minority economist view just a week ago; every cited forecaster expects a hike, disagreeing only on timing.
- Hauser and Hunter’s comments reframed the debate around inflation persistence, not urgency, with Hunter also citing higher oil prices now compounded by Brent above $100.
- Goldman Sachs and Macquarie favor September; Westpac and RBC favor November for stronger inflation confirmation — but none of the four expects the tightening cycle to be over.
- Beyond September, markets price roughly 1.18 cumulative hikes by November 2 and 1.48 by December 7, extending toward about 2.1 by August 2027.
- AUD/NZD has broken above 1.2283 resistance, with 1.2211 as key near-term support and 1.2534-1.2608 as the next major upside zone, though the daily chart is overbought.





