

Live Comments
New Zealand Jobs Surprise: Strong Hiring Outweighs Rise in Unemployment
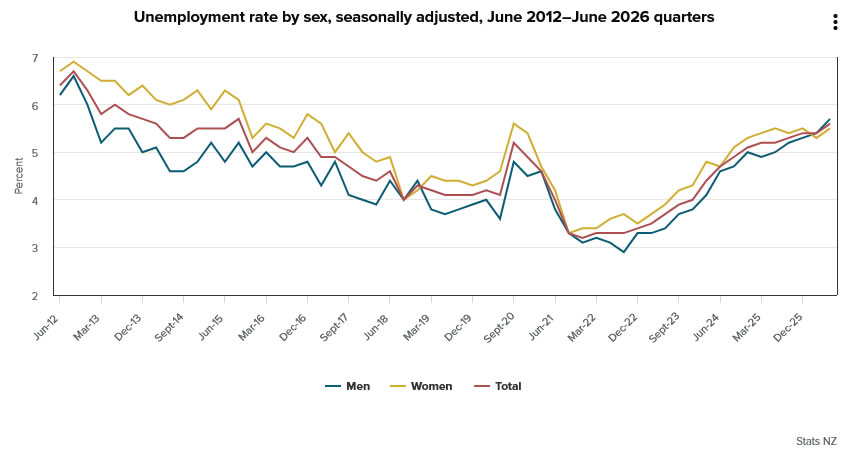
New Zealand's labor market delivered a stronger-than-expected employment report for the second quarter, reinforcing the case for further RBNZ tightening even as the unemployment rate rose. Employment increased 0.5% qoq, comfortably beating expectations of 0.1%, while the Labour Cost Index accelerated to 0.7% qoq from 0.5%. The unemployment rate climbed to 5.6% from 5.3%, above the expected 5.4%, but the rise was accompanied by a higher labor force participation rate, pointing to an expanding labor supply rather than a sharp deterioration in hiring.
The underlying details painted a more balanced picture. The labor force participation rate increased to 70.7%, while the number of people employed rose 1.2% from a year earlier. Private-sector wage growth remained firm at 0.7% qoq, highlighting persistent domestic inflation pressures. At the same time, the underutilisation rate rose to 13.8%, while hours worked edged lower during the quarter, suggesting some additional slack is emerging despite robust hiring.
For the RBNZ, the report is likely to be viewed as supportive of maintaining its tightening bias rather than accelerating it. Strong employment growth and faster wage inflation reinforce concerns that domestic price pressures remain sticky, while the higher unemployment rate appears to reflect greater labor force participation rather than weakening demand for workers. The data therefore strengthen expectations that further policy tightening remains on the table, although the increase in labor market slack argues against an urgent need for more aggressive action.
Data Summary
| Indicator | Q2 2026 | Q1 2026 | Consensus | Assessment |
|---|---|---|---|---|
| Employment Change Q/Q | +0.5% | +0.2% | +0.1% | Strong beat |
| Unemployment Rate | 5.6% | 5.3% | 5.4% | Higher than expected |
| Labour Cost Index Q/Q | +0.7% | +0.5% | +0.6% | Stronger wage growth |
| Labour Force Participation Rate | 70.7% | 70.5% | — | Higher |
| Employment Rate | 66.7% | 66.6% | — | Slightly higher |
| Underutilisation Rate | 13.8% | 13.0% | — | More slack |
| Private Sector LCI Q/Q | +0.7% | +0.5% | — | Accelerated |
| Public Sector LCI Q/Q | +0.4% | +0.4% | — | Unchanged |
Key Takeaways
- Employment growth surprised strongly to the upside, rising 0.5% q/q against expectations of 0.1%, pointing to resilient labour demand.
- The Labour Cost Index accelerated to 0.7% q/q, reinforcing concerns that domestic wage pressures remain persistent.
- Although the unemployment rate rose to 5.6%, the increase coincided with a higher labour force participation rate, suggesting more people entered the workforce rather than widespread job losses.
- The report was not uniformly strong. Underutilisation increased to 13.8% and hours worked edged lower, indicating some labour market slack is emerging.
- Overall, the data are net hawkish for the RBNZ, supporting expectations that further policy tightening remains likely, albeit at a measured pace.
- The report is supportive for the New Zealand Dollar, particularly relative to currencies backed by central banks expected to remain on hold.
US JOLTS Job Openings Slip, But Labor Market Still Shows No Meaningful Weakness
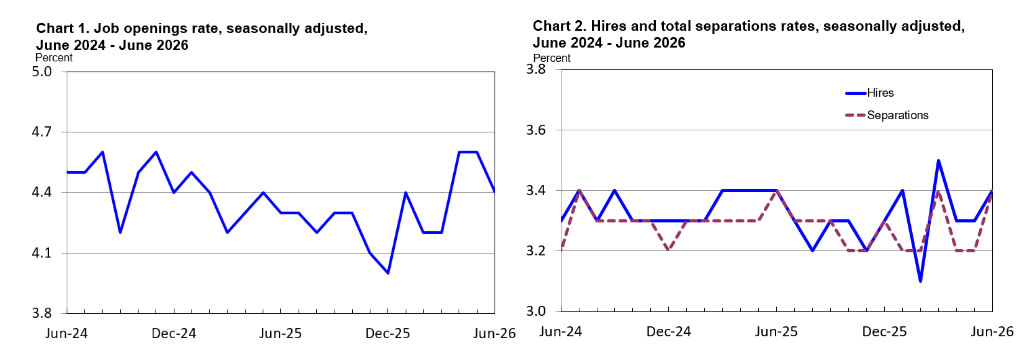
US job openings edged lower in June, but the broader picture remained one of a labor market that is cooling gradually rather than deteriorating. The Job Openings and Labor Turnover Survey (JOLTS) showed vacancies easing from a revised 7.54 million in May to 7.36 million, while the job openings rate slipped from 4.5% to 4.4%. Hires were little changed at 5.35 million, and total separations also held broadly steady, suggesting labor demand remains resilient despite restrictive monetary policy.
The details offered little evidence of broad-based weakness. Job openings increased in transportation, warehousing and utilities as well as federal government, but declined in wholesale trade, nondurable goods manufacturing, and mining and logging. Workers' willingness to change jobs remained subdued, with quits unchanged at 3.2 million, while layoffs and discharges also held steady at 1.8 million, reinforcing the view that employers continue to retain staff despite slower hiring momentum.
The report is unlikely to materially alter expectations for Federal Reserve policy. Coming after Monday's stronger-than-expected ISM Manufacturing survey, the JOLTS data suggest the labor market remains sufficiently firm to support the Fed's wait-and-see approach. Attention now shifts to ADP employment on Wednesday and Friday's Non-Farm Payrolls report, which are likely to carry much greater weight in determining whether markets increase or scale back expectations for another rate hike later this year.
Data Summary
| Indicator | June 2026 | May 2026 (Rev.) | Trend |
|---|---|---|---|
| Job openings | 7.359M | 7.537M | ▼ -178K |
| Job openings rate | 4.4% | 4.5% | Slightly lower |
| Hires | 5.348M | 5.252M | Broadly unchanged |
| Hires rate | 3.4% | 3.3% | Slightly higher |
| Total separations | 5.351M | 5.260M | Little changed |
| Separations rate | 3.4% | 3.3% | Stable |
| Quits | 3.170M | 3.170M | Unchanged |
| Quits rate | 2.0% | 2.0% | Unchanged |
| Layoffs & discharges | 1.828M | 1.811M | Little changed |
| Layoffs rate | 1.1% | 1.1% | Unchanged |
Notable Industry Changes
| Category | June Change |
|---|---|
| Job openings | |
| Transportation, warehousing & utilities | ▲ +97K |
| Federal government | ▲ +39K |
| Wholesale trade | ▼ -74K |
| Nondurable manufacturing | ▼ -55K |
| Mining & logging | ▼ -9K |
| Hires | |
| Federal government | ▼ -6K |
| Quits | |
| Federal government | ▼ -4K |
Key Takeaways
- Job openings edged down to 7.36 million, but remained consistent with a labor market that is cooling gradually rather than weakening sharply.
- Hiring held broadly steady at 5.35 million, while the hires rate ticked up to 3.4%, indicating employers continue to add workers.
- Layoffs and discharges remained unchanged at 1.8 million, suggesting companies are still reluctant to reduce headcount.
- Workers' willingness to change jobs remained subdued, with quits holding steady at 3.2 million and the quits rate unchanged at 2.0%.
- Transportation and warehousing led gains in job openings, while wholesale trade and nondurable manufacturing softened.
- The report is unlikely to materially change Fed expectations, leaving attention firmly on ADP employment and Friday's Non-Farm Payrolls.
Canada’s Trade Surplus Widens, Though Weaker Loonie Boosts Headline
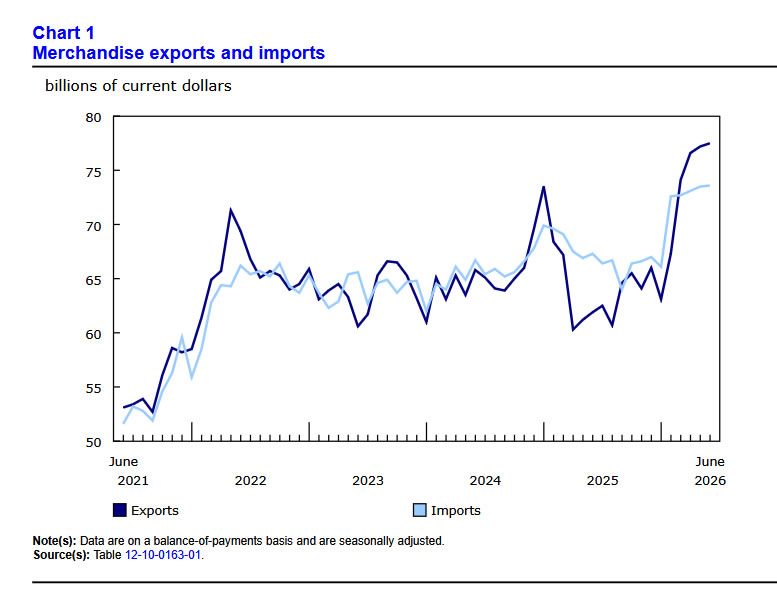
Canada recorded its fourth consecutive monthly merchandise trade surplus in June, with exports and imports both reaching record levels. Exports rose 0.4% m/m to CAD 77.5B, while imports edged up 0.2% to CAD 73.6B, allowing the trade surplus to widen modestly from CAD 3.7B to CAD 3.9B. The latest figures extend a strong run for exports, which have increased for five straight months and are up 22.8% since January.
The headline strength, however, was partly a reflection of exchange-rate movements. The Canadian dollar posted its largest monthly decline against the US dollar since October 2022, boosting the value of trade when converted into Canadian dollars. In US-dollar terms, both exports and imports actually contracted by around -2% in June. Nevertheless, export volumes increased 1.1%, indicating that the improvement was not purely the result of currency translation.
Bilateral trade with the United States remained firm, though Canada's surplus narrowed as imports grew faster than exports. Shipments to the US rose 0.3%, extending their growth streak to five months, while imports climbed 3.0%, driven mainly by computers and related equipment. Beyond the US, imports fell -3.7%, reflecting weaker purchases from China, South Korea and Germany. At the same time, exports to non-US markets increased 0.7%, helped by stronger gold shipments to the United Kingdom despite weaker exports of energy products and aluminum to the Netherlands.
Overall, the June report suggests Canada's external sector remains in good shape, but the details are more nuanced than the headline figures imply. Record export values and a wider trade surplus are encouraging, yet the weaker Canadian dollar exaggerated part of the improvement. With export volumes still advancing and trade outside the United States showing signs of improvement, the underlying trend remains constructive, although sustaining that momentum will likely depend on continued strength in global demand rather than currency effects alone.
Data Summary
| Indicator | June 2026 | May 2026 | Trend |
|---|---|---|---|
| Merchandise exports | CAD 77.5B | CAD 77.2B | ▲ +0.4% (Record high) |
| Merchandise imports | CAD 73.6B | CAD 73.5B | ▲ +0.2% (Record high) |
| Trade balance | CAD 3.9B surplus | CAD 3.7B surplus | Surplus widened |
| Exports (volume) | +1.1% | — | Higher |
| Exports (USD terms) | -2.0% | — | Lower |
| Imports (USD terms) | -2.1% | — | Lower |
| Exports to US | +0.3% | — | Fifth straight gain |
| Imports from US | +3.0% | — | Record high |
| Trade surplus with US | CAD 10.0B | CAD 11.1B | Narrowed |
| Exports to non-US markets | +0.7% | — | Higher |
| Imports from non-US markets | -3.7% | — | Lower |
| Trade deficit with non-US markets | CAD 6.1B | CAD 7.4B | Narrowed |
Key Takeaways
- Canada's merchandise trade surplus widened from CAD 3.7B to CAD 3.9B, marking a fourth consecutive monthly surplus.
- Both exports (CAD 77.5B) and imports (CAD 73.6B) reached record highs, with exports rising for a fifth straight month.
- The weaker Canadian dollar boosted headline trade values. In US-dollar terms, exports and imports both declined around 2%, highlighting the currency's contribution to the record figures.
- Export growth was supported by higher shipment volumes, with real exports increasing 1.1%, indicating underlying trade remained resilient.
- Canada's surplus with the United States narrowed as imports from the US grew faster than exports.
- Trade with the rest of the world improved, helped by stronger gold exports to the UK and weaker imports from China, South Korea and Germany.