

Live Comments
Europe’s June 14.4% YoY Export Rebound Masks Sharp First-Half Trade Deterioration
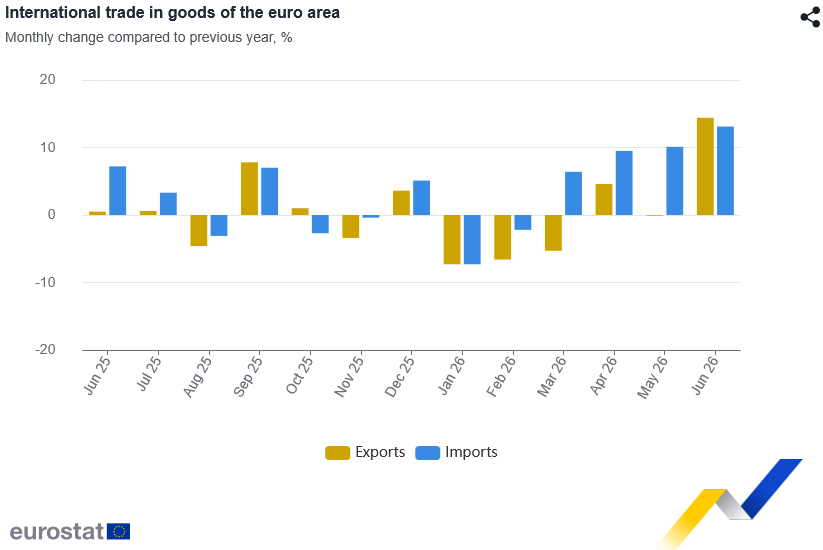
Eurozone goods trade surplus widened from EUR 4.8B last year to EUR 8.6B in June, as exports rose 14.4% y/y to EUR 272.5B and imports increased 13.1% y/y to EUR 264.0B. EU trade surplus, however, narrowed from EUR 5.2B to EUR 3.9B, with exports up 12.5% and imports rising a slightly faster 13.5%. June figures therefore point to a strong rebound in cross-border trade, but not a uniformly stronger external position across region.
First-half data paint a much weaker picture. Eurozone exports slipped -0.2% y/y in January-June while imports rose 4.9%, shrinking cumulative surplus from EUR 82.2B to EUR 9.8B. For EU, extra-regional exports fell -2.1% while imports increased 4.7%, swinging balance from a EUR 74.1B surplus to EUR 14.9B deficit. Intra-regional trade was firmer, rising 4.7% in Eurozone and 5.7% across EU.
Partner breakdown also remained mixed. EU kept sizeable surpluses with US, UK and Switzerland, while deficit with China widened from EUR 31.0B to EUR 35.1B in June. Overall, June rebound is encouraging, but it does not erase deterioration seen over first half. Stronger exports are beginning to help, yet Europe still needs a more sustained improvement before trade can be described as a durable growth tailwind.
Data Summary
| Indicator | Jun 2026 | Jun 2025 | Change |
|---|---|---|---|
| Eurozone Extra-EA Exports | €272.5B | €238.2B | +14.4% |
| Eurozone Extra-EA Imports | €264.0B | €233.4B | +13.1% |
| Eurozone Trade Balance | €8.6B | €4.8B | widened |
| EU Extra-EU Exports | €241.5B | €214.7B | +12.5% |
| EU Extra-EU Imports | €237.7B | €209.5B | +13.5% |
| EU Trade Balance | €3.9B | €5.2B | narrowed |
| Jan–Jun | 2026 | 2025 | Change |
|---|---|---|---|
| Eurozone Extra-EA Exports | €1,487.2B | €1,490.1B | -0.2% |
| Eurozone Extra-EA Imports | €1,477.4B | €1,407.9B | +4.9% |
| Eurozone Trade Balance | €9.8B | €82.2B | Narrowed sharply |
| EU Extra-EU Exports | €1,317.0B | €1,345.9B | -2.1% |
| EU Extra-EU Imports | €1,331.9B | €1,271.8B | +4.7% |
| EU Trade Balance | -€14.9B | €74.1B | Swung to deficit |
Key Takeaways
- Eurozone goods surplus widened from €4.8B to €8.6B y/y in June, as exports rose 14.4%, faster than 13.1% import growth.
- EU surplus moved in opposite direction, narrowing from €5.2B to €3.9B, as imports grew slightly faster than exports.
- June strength contrasts sharply with first-half trend: Eurozone surplus collapsed from €82.2B to €9.8B.
- EU external balance deteriorated further, swinging from €74.1B surplus to €14.9B deficit over January-June.
- EU continued to run sizable surpluses with US, UK and Switzerland, while deficit with China widened from €31.0B to €35.1B in June.
- Overall picture is improvement at margin rather than a completed trade recovery; June exports rebounded strongly, but first-half balances remain substantially weaker.
Swiss GDP Surges 1.5% in Q2 as Industry Drives Growth
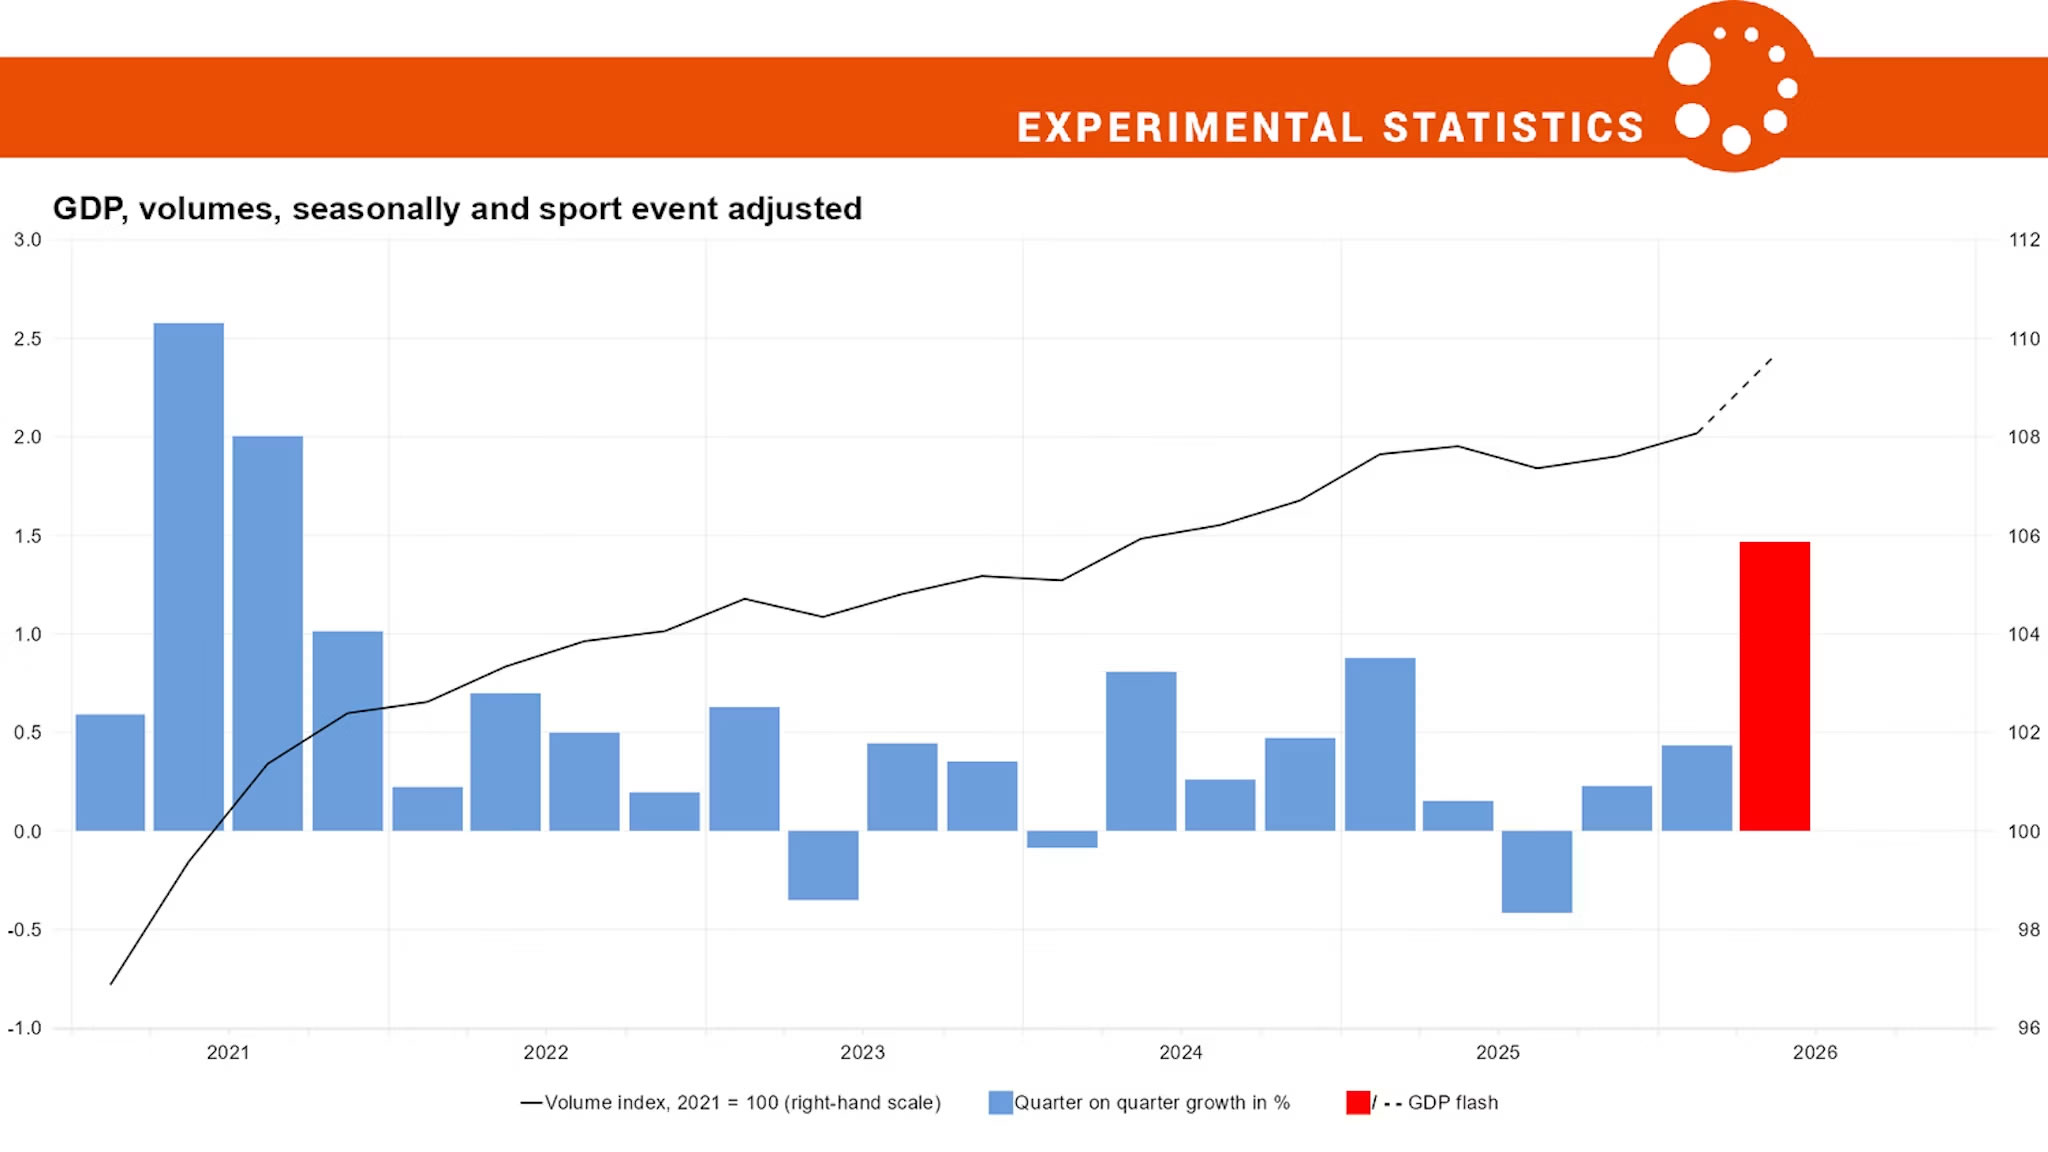
Swiss economy accelerated sharply in Q2, with sport-event-adjusted real GDP growth rising from 0.4% to an estimated 1.5% q/q, according to SECO’s flash estimate. That would mark strongest quarterly expansion since 2021 based on current series. SECO said industrial sector made largest contribution to growth, driven particularly by chemicals and pharmaceuticals, while services also expanded overall.
Strength extends rebound already visible in Q1, when manufacturing grew 1.5% q/q after contracting 3.0% in Q4. But Q2 flash provides no detailed sector breakdown beyond SECO’s broad assessment, so it is too early to judge how widely expansion spread beyond chemicals and pharmaceuticals. Flash estimate is also based partly on estimated inputs and may be revised when full quarterly GDP data are released.
Still, headline result points to considerably stronger Swiss growth momentum than previously evident. A 1.5% quarterly expansion led by industry reduces concern that economy is being materially constrained by current financial conditions and gives SNB less reason to respond to growth weakness. Key question for final release will be whether exceptional industrial contribution was accompanied by broad gains elsewhere or whether Q2 strength was concentrated in a narrow group of export-heavy sectors.
Key Takeaways
- Swiss sport-event-adjusted GDP growth accelerated from 0.4% to an estimated 1.5% q/q in Q2, potentially strongest quarterly expansion since 2021.
- Industry made largest contribution, led especially by chemicals and pharmaceuticals, while services also expanded.
- Q2 strength builds on manufacturing rebound already seen in Q1, when output rose 1.5% after a 3.0% contraction in Q4.
- Flash estimate is based on incomplete early data and may be revised, while detailed sector breakdown is not yet available.
- Headline result points to a much stronger Swiss growth backdrop, reducing concern that economy is being materially constrained by current financial conditions.
- For SNB, stronger growth lowers urgency to respond to economic weakness, though final policy implications depend on whether expansion proves broad based rather than concentrated in pharma-led industry.
NZ PMI Manufacturing Cools to 54.3 After June Surge, Expansion Holds
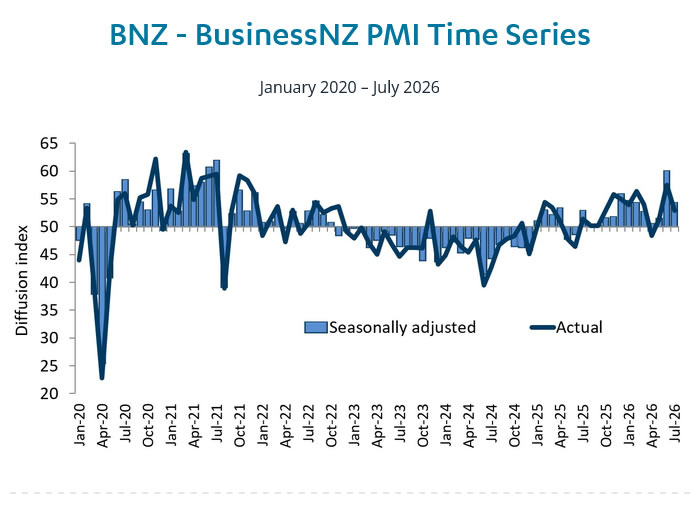
New Zealand manufacturing remained firmly in expansion in July, though momentum moderated after June’s exceptional surge. BusinessNZ PMI Manufacturing fell from 60.1 to 54.3, still comfortably above 50 expansion threshold and long-term average of 52.5. All five sub-indices remained above 50, with Production easing from 59.2 to 57.3, Deliveries from 57.6 to 55.8, Employment from 55.6 to 52.8, and Finished Stocks from 56.9 to 53.2.
Most notable slowdown came from New Orders, which dropped sharply from 64.1 to 53.3, suggesting forward demand normalized much faster than current production. Business sentiment was also considerably less upbeat than headline PMI, with 57% of respondent comments negative. Manufacturers continued to cite Middle East conflict, high fuel and raw-material costs, weak customer spending and election uncertainty as concerns, although steady order books and stronger export sales provided some offset.
Overall, July reading looks more like normalization from an unusually strong June than a renewed downturn. As BNZ Senior Economist Doug Steel noted, month-to-month volatility is common and 54.3 is “not an immediate cause for concern.” Still, sharp retreat in New Orders and deterioration in sentiment warrant attention, particularly if cost pressures stay elevated. For RBNZ, data continue to point to an expanding manufacturing sector, but with enough moderation to avoid adding materially to already hawkish policy expectations.
Data Summary
| Component | Current | Previous | Trend |
|---|---|---|---|
| PMI Manufacturing | 54.3 | 60.1 | Slower expansion |
| Production | 57.3 | 59.2 | Slower expansion |
| Employment | 52.8 | 55.6 | Slower expansion |
| New Orders | 53.3 | 64.1 | Sharp moderation |
| Finished Stocks | 53.2 | 56.9 | Slower expansion |
| Deliveries | 55.8 | 57.6 | Slower expansion |
Key Takeaways
- New Zealand PMI Manufacturing fell from 60.1 to 54.3 in July, but stayed above both 50 expansion threshold and long-term average of 52.5.
- Every major sub-index remained in expansion, indicating broad activity stayed positive despite slowdown from June’s exceptional reading.
- New Orders fell most sharply, from 64.1 to 53.3, pointing to much softer forward demand momentum.
- Production remained strongest component at 57.3, while Employment was weakest at 52.8.
- Sentiment was less encouraging than activity data, with 57% of respondent comments negative amid high fuel, freight and raw-material costs, Middle East tensions and cautious customer spending.
- July is best read as normalization rather than a renewed downturn, but weaker New Orders make upcoming surveys important for confirming whether expansion can hold.