

Live Comments
New Zealand Input PPI Rises 2.9% in Q2, Output Prices Up 1.6%
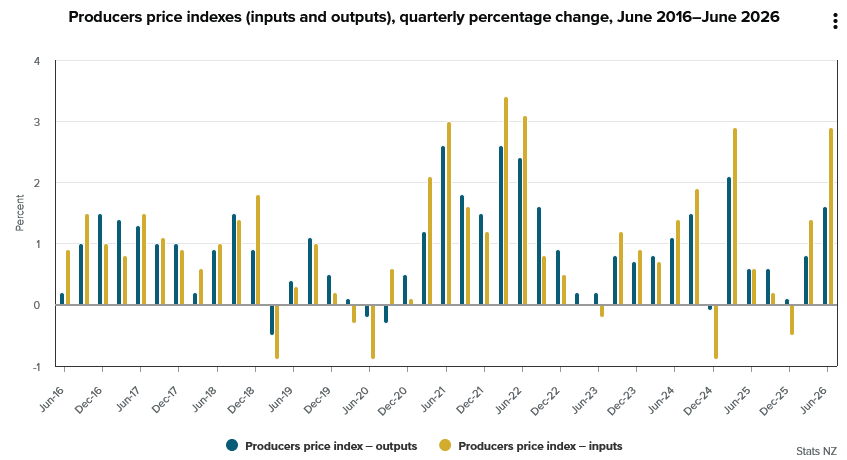
New Zealand producer price pressures accelerated sharply in Q2, with input PPI rising 2.9% q/q from 1.4% in Q1, more than double 1.3% consensus. Output PPI also strengthened, rising 1.6% from 0.8%, twice 0.8% expected. Stats NZ said producers faced higher costs for inputs including fuel, power and raw materials.
The gap between input and output prices was particularly notable. Producers’ costs rose almost twice as fast as prices received for their goods and services, pointing to potential pressure on margins if firms are unable to pass those increases through. Consumer prices rose 1.5% q/q over the same period, slightly below output PPI and well below input-cost growth.
Cost pressures were broader across the economy. Farm Expenses Price Index rose 3.8% q/q, while Capital Goods Price Index increased 1.8%. Overall, Q2 data show a clear reacceleration in upstream inflation, with key question now whether businesses continue absorbing higher costs or increasingly pass them into final prices.
Data Summary
| Indicator | Actual | Expected | Previous |
|---|---|---|---|
| PPI Input q/q | 2.9% | 1.3% | 1.4% |
| PPI Output q/q | 1.6% | 0.8% | 0.8% |
| CPI q/q | 1.5% | — | 0.9% |
Key Takeaways
- New Zealand producer cost pressures accelerated sharply in Q2, with PPI Input rising from 1.4% to 2.9% q/q, more than double 1.3% consensus.
- PPI Output increased from 0.8% to 1.6%, also twice 0.8% expected.
- Input costs rose substantially faster than output prices, suggesting businesses either absorbed part of increase through margins or still have costs to pass through.
- Stats NZ highlighted higher fuel, power and raw-material prices as important contributors to input-cost increase.
- Producer input inflation at 2.9% was nearly twice Q2 CPI increase of 1.5%, highlighting strength of upstream cost pressures.
- Broader cost measures were also firm, with Farm Expenses Price Index up 3.8% and Capital Goods Price Index up 1.8%.
- Overall, Q2 data show a clear reacceleration in production costs, with future inflation impact depending on how much businesses pass through to customers.
Germany ZEW Sentiment Strengthens to 34.2 as Current Conditions Improve
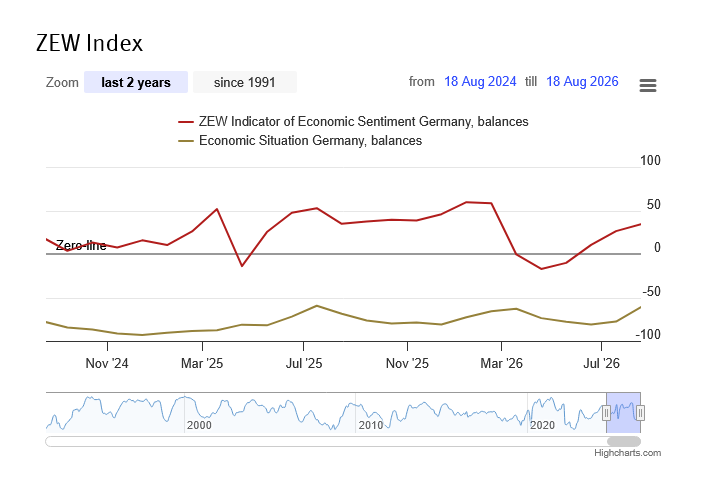
German investor sentiment improved further in August, with ZEW Economic Sentiment rising from 26.3 to 34.2, above 30.1 consensus. Current Situation Index also strengthened sharply from -77.6 to -61.1, much better than -68.8 expected. ZEW attributed improvement to solid quarterly corporate results, strong recent exports and support from federal infrastructure programs, although current-condition reading remains deeply negative.
The improvement was broad across sectors. Vehicle-industry expectations jumped by 22.2 points, though balance stayed below zero, while chemical and pharmaceutical, mechanical engineering and metals industries also recorded strong gains. Private-consumption expectations improved by 9.0 points to -6.2, while construction expectations edged up to +2.1. ZEW nevertheless flagged record-low Rhine water levels as an acute risk to activity.
Eurozone sentiment followed same direction. Economic Sentiment rose from 23.4 to 31.4, beating 25.0 forecast, while Current Situation assessment improved by 16.2 points to -21.5. Overall, August survey points to a more convincing improvement in expectations across Germany and wider Eurozone, though still-weak current-condition readings show recovery in confidence is running ahead of the underlying economy.
Data Summary
| Component | Current | Previous | Trend |
|---|---|---|---|
| Germany ZEW Economic Sentiment | 34.2 | 26.3 | Improved strongly |
| Germany ZEW Current Situation | -61.1 | -77.6 | Less negative |
| Eurozone ZEW Economic Sentiment | 31.4 | 23.4 | Improved strongly |
| Eurozone ZEW Current Situation | -21.5 | -37.7 | Less negative |
| Germany Private Consumption Expectations | -6.2 | -15.2 | Improved |
| Germany Construction Expectations | 2.1 | 0.7 | Improved |
Key Takeaways
- Germany ZEW Economic Sentiment rose from 26.3 to 34.2, comfortably above 30.1 consensus.
- Current Situation Index improved sharply from -77.6 to -61.1, also beating -68.8 expected.
- Improvement was broad across industries, led by a 22.2-point rise in vehicle-sector expectations.
- Private-consumption expectations strengthened from -15.2 to -6.2, while construction expectations improved from 0.7 to 2.1.
- ZEW linked stronger outlook to solid corporate results, recent export strength and federal infrastructure programs.
- Record-low Rhine water levels were highlighted as an acute downside risk to activity.
- Eurozone sentiment also strengthened, with Economic Sentiment rising from 23.4 to 31.4, above 25.0 consensus.
- Eurozone Current Situation improved from -37.7 to -21.5, though it remained in negative territory.
- Overall, August survey shows confidence improving faster than actual conditions, with expectations increasingly positive while current assessments remain weak.
UK Payroll Employment Falls as Unemployment Holds at 4.9%
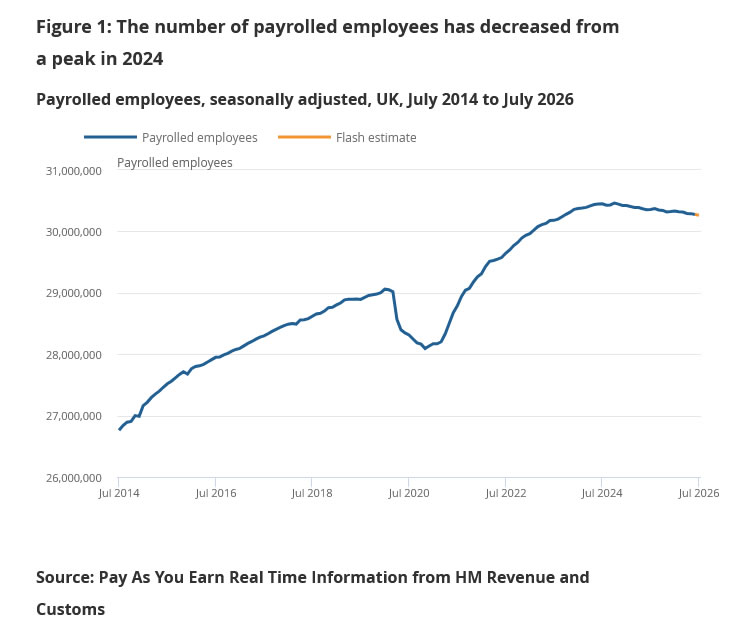
UK labor market continued to soften in July, with early payroll estimates showing employee numbers falling by -13,000 from June and by -94,000 from a year earlier. June’s monthly decline was also revised from -4,000 to -13,000, reinforcing gradual downtrend from 2024 peak.
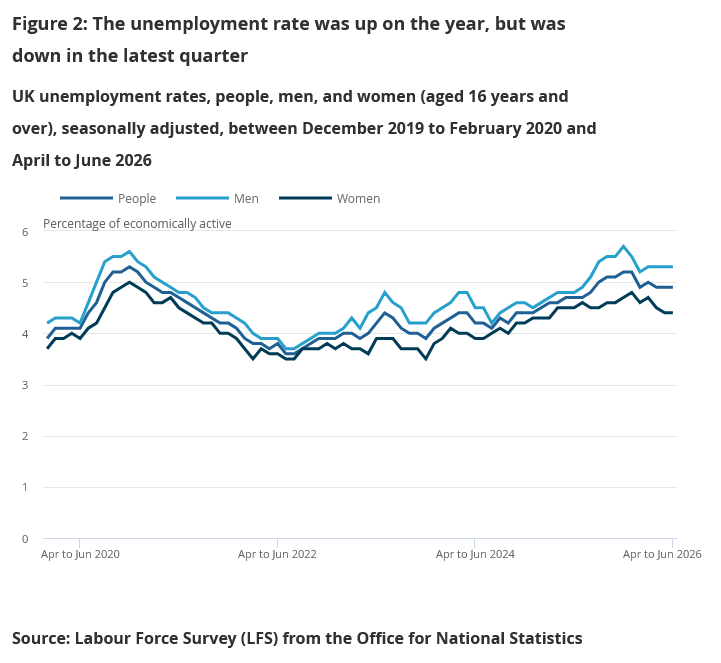
ILO unemployment rate held at 4.9% in three months to June, slightly above 4.8% expected, although claimant count moved in opposite direction with an -11,000 decline versus expectations for a 16,500 increase.
Wage data were mixed. Regular earnings growth edged up from 3.4% to 3.5% y/y in April-June, above 3.4% consensus Total earnings growth slowed from 4.3% to 4.1%, matching expectations.
More timely payroll-based median pay growth also eased from 4.5% to 4.2% y/y in July, suggesting underlying wage momentum is gradually cooling despite firmness in regular pay.
Overall, employment conditions are weakening more clearly than wages. Payrolls continue to drift lower and unemployment remains elevated, but pay growth is proving slower to soften.
Data Summary
| Indicator | Actual | Expected | Previous |
|---|---|---|---|
| Payrolled Employees m/m, Jul | -13K | — | -13K* |
| Payrolled Employees y/y, Jul | -94K | — | — |
| Payrolled Employees y/y, Jul | -0.3% | — | — |
| Payrolled Employees Level, Jul | 30.3M | — | — |
| ILO Unemployment Rate, 3M to Jun | 4.9% | 4.8% | 4.9% |
| Claimant Count Change, Jul | -11.0K | +16.5K | +6.7K |
| Average Earnings ex Bonus, 3M y/y Jun | 3.5% | 3.4% | 3.4% |
| Average Earnings incl Bonus, 3M y/y Jun | 4.1% | 4.1% | 4.3% |
| Median Monthly Pay y/y, Jul | 4.2% | — | 4.5% |
*June payroll decline was revised from -4K to -13K.
Key Takeaways
- UK payrolled employment fell another 13K in July, while June was revised to show the same decline, reinforcing gradual weakening from 2024 peak.
- Payrolls were 94K lower than a year earlier, equivalent to a 0.3% annual decline.
- ILO unemployment rate held at 4.9%, slightly above 4.8% consensus.
- Claimant count provided main positive surprise, falling 11K instead of expected 16.5K increase.
- Wage signals were mixed. Regular earnings growth firmed from 3.4% to 3.5%, while total earnings slowed from 4.3% to 4.1%.
- More timely median payroll pay growth eased from 4.5% to 4.2% in July.
- Overall picture is one of employment weakening faster than wages, with payrolls drifting lower but pay growth cooling only gradually.