
Australia & New Zealand Weekly
Week beginning 17 September 2018
- AUD on track to reach USD 0.70 before leg down in the US cycle.
- Australia: Westpac-MI Leading Index, RBA minutes, RBA Assistant Governor (Financial Markets) Kent speaks.
- NZ: Westpac-MM consumer sentiment, GDP, current account.
- Europe: ECB President Draghi speaks, consumer confidence.
- US: housing starts and building permits.
- Central bank meetings: BoJ, BoT.
- Flash PMI’s for Japan, the Euro Area and the US.
- Key economic & financial forecasts.
Information contained in this report current as at 14 September 2018.
AUD on Track to Reach USD 0.70 Before Leg Down in the US Cycle
Over the last month the Australian dollar has fallen from around USD0.74 to USD0.71 and is now settling around USD0.72. The AUD is closing in on our mid 2019 forecast of USD0.70 at a much faster pace than we had envisaged.
Recall that the key arguments we have used throughout 2018 to signal a significant fall in AUD from its peak in January 2018 of USD0.81 have been around: Australian interest rates falling much further below US rates than had been expected by markets; a general slowdown in the world economy, particularly through 2018 and 2019; some deterioration in the Australian housing market; and political uncertainty associated with the Australian Federal Election due by May 2019.
These issues have been evolving largely as we expected.
In July last year markets were priced for the RBA cash rate to be around 40bps above the Federal Funds rate by end 2018 whereas Westpac argued that the RBA cash rate would be around 40bps below the Federal Funds rate by that time. Markets have now largely embraced our call although, with the advent of the tax cuts and spending boost from the Trump administration, we revised up our Fed call to give a margin of around 88bps by end 2018. Markets are now largely in line with our call for end 2018 but still remain somewhat cautious for mid-2019 with Westpac expecting a margin of 137bps compared to market expectations of 115-120bps. That interest rate differential points to further downside risks for the AUD.
Disappointing developments in Europe; an ongoing slowdown in China; and some instability amongst some emerging markets support our view that global growth in 2019 will slow from 3.8% to 3.6% with further weakness expected in 2020. Slowing US growth remains the cornerstone of this view.
In Australia, house prices have been falling in the two largest cities – Sydney and Melbourne – through most of 2018. Foreign investors remain nervous about Australia’s housing market given Australia’s high household debt and stretched affordability. The banks are the main vehicle for borrowing to fund this debt and, with their assets dominated by mortgages, international lenders are always sensitive to adverse developments in the housing market.
Political uncertainty has also been a factor for markets following the recent leadership change in our Federal Government. Several elections are due between now and mid- 2019 including for the Federal Government (by 18 May 2019 at the latest); the Victorian State Government (scheduled for 24 November) and the NSW State Government (scheduled for 23 March).
Last month we reaffirmed the target of USD0.70 for the AUD (around USD0.74 at the time) by mid-2019. The move to USD0.72 has run ahead of our timetable.
Fears of a global trade war and general contagion through emerging markets seem to be dictating this current development. We would argue that these two factors will prove to be largely transient in terms of implications for the AUD.
While the trade dispute between the US and China could escalate and certainly has further to run, we strongly doubt that a bilateral dispute is likely to spread globally – a view that appears to have driven the recent sharp drop in the AUD. The prospect of the US and China ‘dumping’ goods on other countries which in turn respond with their own across the board tariffs seems unlikely. Currency markets are currently running on momentum and emotion.
Westpac puts its highest weight on our medium term guidance to customers. We need to be careful not to extrapolate short term movements unless we believe the changes supporting those movements are going to be sustained.
Accordingly we are slightly lowering our end 2018 forecast from USD0.73 to USD0.72 and expect the final adjustment in the profile to USD0.70 to play out through the first half of 2019. However we are not sharply lowering our target low point in AUD – at this stage recent movements look to be an overreaction to fears that will not be franked.
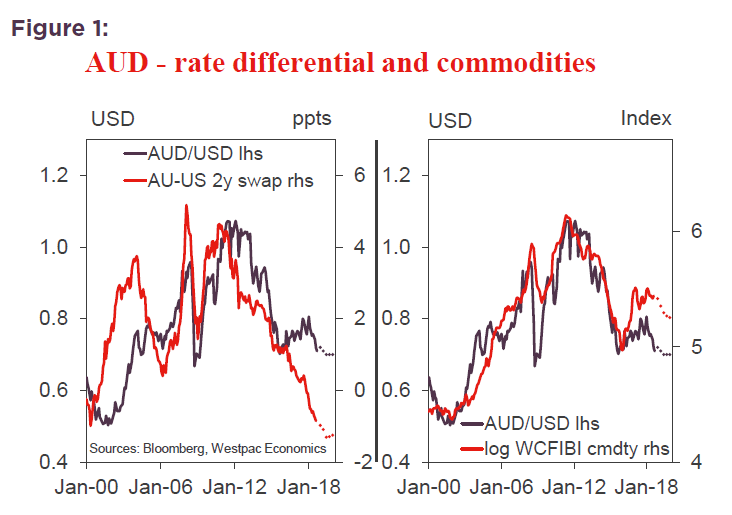
In that regard we point to the outperformance of Australia’s basket of commodity export prices. As noted in Figure 1 export prices are running well ahead of the normal relationship with the Australian dollar. That is, on the basis of the export price basket, the Australian dollar looks under-valued. On the other hand there is a looser relationship between the AUD/USD and the AU/US interest rate differential.
Figure 1: points to the AUD falling further given the sharp deterioration in the interest rate differential. Clearly, the commodity factor is offsetting. Our fair value models which seek to balance the relative impact of rates and commodities, favour a stronger relationship with commodity prices and are currently signalling that the net effect has the AUD undervalued.
Risks to our current forecasts centre around Fed policy. Our central view is that the Fed will tighten four more times in this cycle with the tightening cycle coming to an end in June next year. Further Fed hikes in the second half of 2019 would extend that interest rate differential beyond our central view and put additional downward pressure on the AUD even if the basket of export prices holds up.
Nevertheless our central view is that the peak in the USD will be around the June quarter 2019 when the market abruptly shifts to recognising that the Federal Funds rate has peaked. In extending our forecasts through 2020 we believe that the issues driving the AUD/USD cross will be dominated by the USD. With the Fed expected to go on hold by mid-2019, markets moving to price in rate cuts and the US yield curve inverting through 2020, the consequent weakening of the USD should see AUD lifting through 2020 to USD0.75 by year’s end.
The week that was
Updates on consumer and business sentiment this week highlight its susceptibility to political and global uncertainty.
For consumer sentiment, up until August, 2018 had been a favourable period, with the headline index remaining above its long-run average of 101.5. However, this changed in September as the index fell back to 100.5 despite persistent strength in the labour market and 4.0% annualised GDP growth through the first half of 2018 – reported early September. In the month, these factors look to have been well and truly offset by political instability and announced increases in mortgage interest rates for all borrowers. The latter comes at an inopportune time for households, with family finances already under pressure from low wage growth; elevated debt levels and rising oil prices. Whereas headline sentiment has been above average this year, the family finance components have remained below throughout – all the more so after a 3.6% fall in these indexes in September. While it doesn’t immediately affect household cash flows, declining house prices are also likely weighing on household’s financial views. Here there remains considerable uncertainty, with our survey’s house price expectations measure down 3.0% in the month and 23% over the year to be 14% below average. It is not surprising then that ‘time to buy a dwelling’ is also 14% below average at present.
For the business sector, political uncertainty also looks to have shocked sentiment, with NAB’s confidence measure falling 3pts in August to a below average read of +4. Confidence was steady in the mining states of WA and Qld, but deteriorated in NSW and Vic. Against this decline in confidence, conditions actually improved in the month, rising +2 to +15 – an elevated level versus history, albeit off the highs seen from late-2017 to April 2018, circa +19. Importantly, the strength in conditions is being seen across all the major states, a situation not seen since 2007. By industry however, conditions remain mixed, with the strongest momentum apparent in mining, construction and manufacturing, and the weakest in consumer-related sectors. On the manufacturing sector, additional detail was provided by our AustChamber-Westpac Survey of Industrial Trends.
Regarding household incomes, the August labour force survey was constructive. Following a 4k decline in jobs in July, employment jumped 44k in August. This result kept the average monthly pace for 2018 around 20k, well below 2017’s extraordinary 34k pace but still well ahead of population growth (2.2% in six-month annualised terms versus circa 1.7% for the population). While the unemployment rate was unchanged at 5.3% in the month, the latest quarterly update for underemployment put it at its lowest level since May 2014. This outcome implies labour market slack is being eroded, albeit slowly, providing support for the view that wages growth has troughed. That said, we remain sceptical of the pace at which the remaining slack can be reduced and thus the possible trajectory for wages growth hence.
Moving offshore, sentiment has again been in focus this week. Both the ECB and BOE held to a constructive central view on the outlook while remaining cognisant of the risks. For the ECB, the risks to the outlook remain balanced. On the one hand are the global concerns emanating from trade tensions; emerging markets; and broader financial market uncertainty. On the other however is robust strength in the Euro Area’s labour market which is seeing expectations for wages growth firm. On the central view, the growth forecasts of the ECB Governing Council have been edged down, but through 2020 they remain above trend. As such, inflation is expected to head back towards target over that period. Throughout the forecast horizon, there will be no cause to rapidly shift the policy stance.
BOE Governor Carney’s reported remarks to a Cabinet meeting seem to have received greater press coverage than the largely as-expected meeting decision statement. Highlighted by the Financial Times were particular concerns over house prices; employment and real incomes, along with the potential inability of the BOE to act to offset a marked economic deterioration from a no-deal Brexit because a reduction in supply would arguably result in inflation pressures, as would a weaker currency. More positively, the current plan of Prime Minister Theresa May was viewed favourably versus the BOE’s current base view for Brexit. Hence, if that deal eventuates, there may be upside risks for the UK economy.
To the US then, the week started off on a positive footing after another strong employment report, within which an acceleration in hourly earnings growth was the most notable development. While we believe that the acceleration is likely to remain well contained, at least until remaining labour market slack is worked through, the trend is most certainly up. Late in the week, below expectation producer and consumer price reports for August have highlighted that inflation also remains in hand. We continue to expect the headline CPI measure (2.7%yr) to trend back towards core inflation (2.2%yr) and the PCE measures (2.3%yr and 2.0%yr respectively in July) through the remainder of 2018. Though risks will remain skewed to the upside given the threat of tariffs and Hurricane Florence.
Chart of the week: Market Outlook – emerging markets
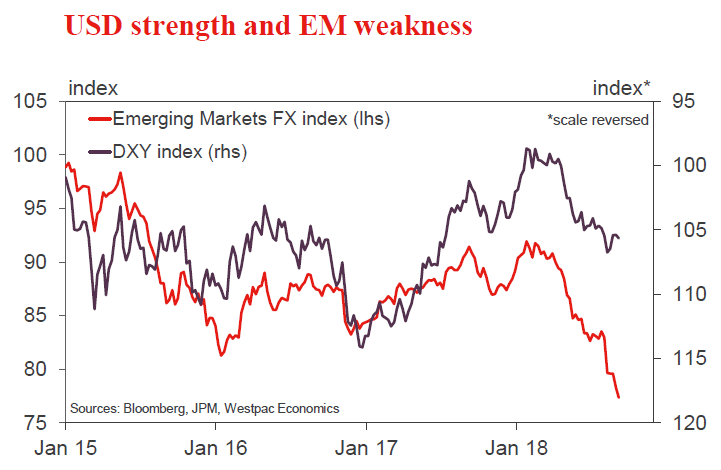
In our Market Outlook is an assessment of emerging market developments as they pertain to trade uncertainties and broader concerns regarding financial stability and capital flight. Here we are not focused on Turkey and Argentina, but rather the emerging markets of Asia which are seen as potential contagion risks. In keeping with our expertise and their significance to Australia, the focus is on China and India. The former has weathered significant pressure this past month with little change in its currency. For India, their current account and fiscal deficits have instead resulted in further pressure on the Rupee. In both cases however, underlying economic strength points to resilience to current headwinds that, in time, will become apparent to markets. As a final point, this edition also contains an updated assessment of the Australian outlook to the end of 2020 post Q2 GDP and a timely piece on the Australian housing market focusing on the build-up of unsold stock on the market – a risk to prices in addition to sentiment.
New Zealand: week ahead & data wrap
Not bad at all
A lot of the commentary on the New Zealand economy has turned decidedly gloomy, in part prompted by the plunge in surveyed business confidence. But indicators of real activity actually show a confluence of solid gains over the June quarter. While we think that next week’s GDP figures will overstate the case a little, the underlying picture is of an economy that continues to grow slowly but steadily.
We’re expecting next Thursday’s GDP release to show a 0.9% rise for the June quarter, following three quarters of subdued growth between 0.5% and 0.6%. Our forecast would see the annual rate of growth hold steady at 2.7%. While the economy doesn’t appear to have slowed further this year, it is still well down from its peak growth rate of 4% in 2016.
In part, our forecast reflects some large one-offs in particular sectors, where the impact on GDP is uncertain and is unlikely to be repeated. Hydroelectric power generation rose sharply after a low March quarter, rail freight has rebounded back to where it was before the Kaikoura earthquake, and public sector employment appears to have risen strongly.
However, there is also likely to be a substantial negative impact on growth from temporary shutdowns in oil refining and methanol production. We expect these to knock about 0.2% off June quarter GDP, but this impact will be added back into September quarter growth (where we have revised up our forecast slightly to 0.7%).
Setting aside those temporary influences, recent surveys have pointed to solid growth across a range of sectors. Retail trade rose by 1.1%, building activity was up 0.8%, and wholesale trade rose an estimated 1.6% after adjusting for prices. A strong lift in hours worked in the Quarterly Employment Survey, along with other sectoral surveys, point to strong growth in many of the services sectors.
The manufacturing sector was mixed. Dairy and meat processing saw strong gains compared to a weak March quarter, whereas wine production fell back after a jump in Q1. There was a second quarter of strong growth in machinery and equipment manufacturing, which suggests that businesses are still prepared to invest in their productive capacity.
Our forecast of a 0.9% rise in GDP appears to be at the top of the market range. More notably, it’s quite a bit higher than the Reserve Bank’s forecast of 0.5% growth in its August Monetary Policy Statement. This difference is important, given the RBNZ’s recent comments that it is nearing the trigger point for cutting the OCR. Financial markets have taken this to heart, with interest rate markets giving close to a 50% chance of a cut in the next year, and the New Zealand dollar falling to its lowest levels since early 2016.
How would the RBNZ’s thinking be swayed if GDP turned out in line with our forecast? You could argue that June quarter data is quite dated, and that plunging business confidence is signalling a downturn yet to come. Indeed, the RBNZ’s own comments seemed to gloss over the June quarter outcome, and focused on the need to see a pickup in growth in the September quarter, as increased government spending and transfers to households kick in.
A better than expected starting point for the economy still matters, and it’s unlikely that the RBNZ would be able to dismiss all of a June quarter surprise as temporary. Nevertheless, we’re also keeping a close eye on the flow of high-frequency data for any signs that the economy has taken a turn since June. The handful of indicators that we have so far don’t point to any change in the economy’s momentum one way or another.
Electronic card spending rose by 1% in August, more than we expected. However, that was balanced out by a surprising downward revision to the July figures, which are now reported to be up just 0.2%. The downward revision to fuel spending is curious, given we know that petrol prices increased over the month (including the introduction of Auckland’s 10c a litre regional fuel tax), and that fuel spending rose sharply again in August. But averaging out the two months suggests that retail spending continued to grow at around the same pace as in recent months.
August was a mixed month for the housing market. House prices have continued to fall gradually in Auckland, but elsewhere they have risen at a slightly faster pace in the last couple of months. The latter is likely due to the recent decline in mortgage rates, something that we think will continue to support prices in the near future. (Further cuts announced this week have taken some fixed-term mortgage rates down to new record lows). Auckland’s underperformance is understandable given the range of new Government policies aimed at dampening housing market speculation, as the Auckland market has tended to have a relatively high proportion of investors.
Elsewhere, the manufacturing sector PMI lifted a little in August, though it still suggests a slower pace of growth this year compared to last year. Measures of job advertisements and traffic volumes also fared well in August. However, these monthly indicators can be very choppy, and it takes some time to discern whether there have been any genuine changes in the trend.
We do think there’s a serious chance that the RBNZ decides to cut the OCR sometime in the next year, even without a significant downturn in the economy. Inflation has been stubbornly on the lower side of the RBNZ’s inflation target midpoint, and there doesn’t seem to be much risk of the economy overheating. However, we think that a stronger starting point for activity, higher near-term inflation (partly due to rising fuel prices) and a bigger than anticipated fall in the exchange rate will be enough to stay the RBNZ’s hand for now.
Data Previews
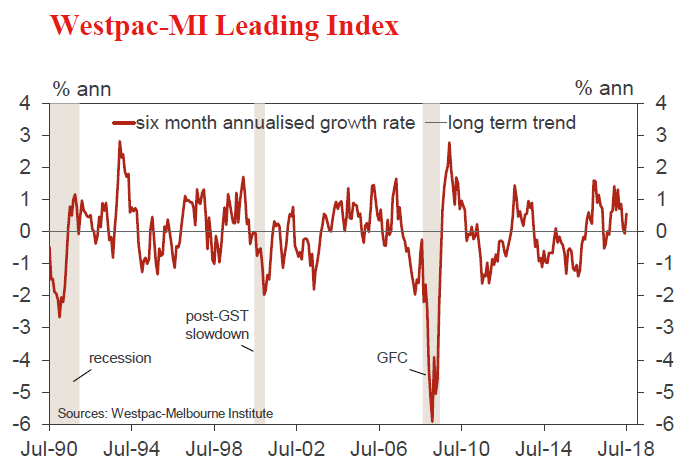
Aus Aug Westpac-MI Leading Index
- Sep 19, Last: +0.55%
The six month annualised growth rate in the Westpac- Melbourne Institute Leading Index, which indicates the likely pace of economic activity relative to trend three to nine months into the future, rose from -0.06% in June to +0.55% in July. Despite the solid rebound from last month’s below trend read, the Leading Index growth rate has still slowed materially since the start of the year, the growth rate peaking at +1.31%in February.
The August read will include a mixed bag of monthly updates. Dwelling approvals (down -5% vs 6.4% last month) and the Westpac-MI Consumer Expectations Index (down -3.2% vs -3% last month) recorded softer reads. Against this, commodity prices (up 1.8% in AUD terms vs -0.3% last month) and the Westpac-MI Unemployment Expectations Index posted solid gains.
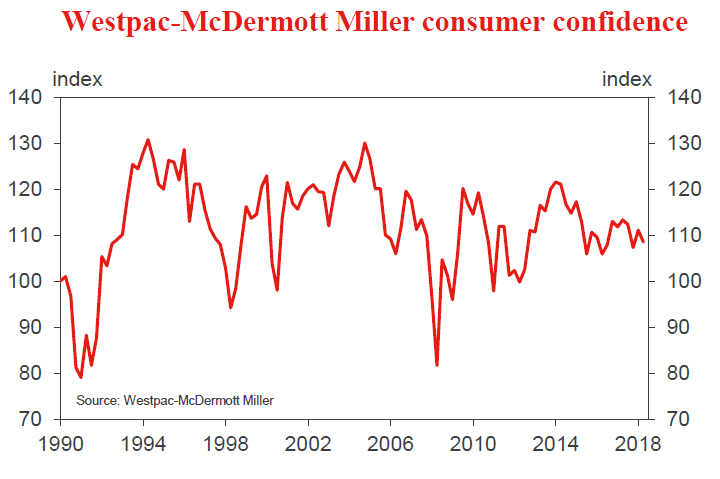
NZ Q3 Westpac McDermott Miller Consumer Confidence
- Sep 19, Last: 108.6
Consumer confidence fell in June, taking it slightly below its long-run average. The drop in confidence was widespread, and consistent with other signs that the edge has come off the economy’s upturn. That said, the drop in confidence hasn’t been particularly large to date. That speaks to more of a general malaise among households, rather than specific worries about the direction the economy is heading.
The exception to the weaker tone of the June survey was households’ perceptions as to whether it’s a good time to buy a major household item, which rose for a second quarter.
The September quarter survey will provide a look at how households’ spending appetites are faring as the Government’s Families Package has been rolled out.
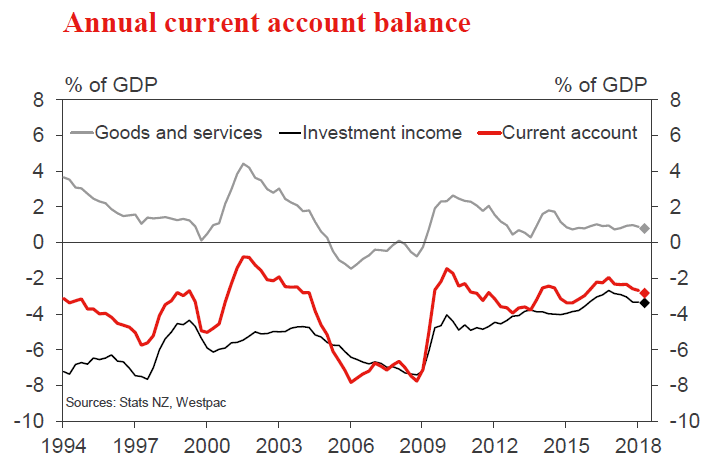
NZ Q2 current account, % of GDP
- Sep 19, Last: -2.7%, Westpac f/c: -2.8%, Mkt f/c: -2.9%
We expect a current account deficit of 2.8% of GDP for the year to June. This represents a slight widening from what we expect to be a revised 2.7% of GDP in March. Annual revisions to the balance of payments have led to a sharp lift in services exports for the last few years.
The goods balance improved in the June quarter as export prices and volumes recovered from a weak March quarter. Imports remain elevated, particularly for plant and machinery. We expect an increase in the investment income deficit, due to higher profits for foreign-owned firms in New Zealand.
The current account deficit remains low relative to history, and current levels support a further improvement in New Zealand’s net overseas liabilities position.
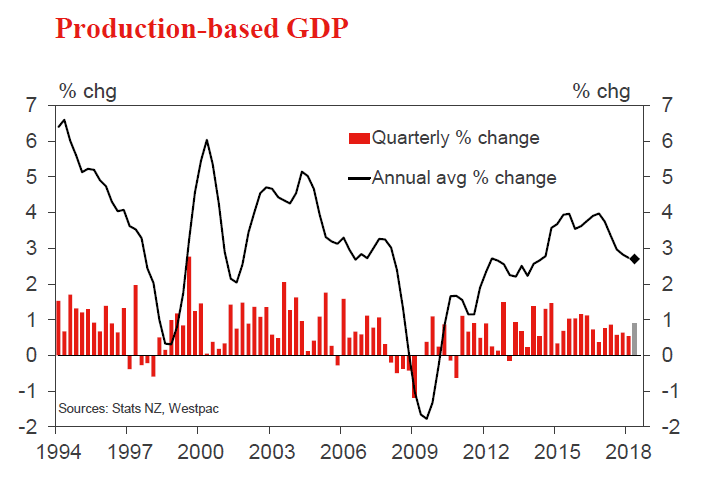
NZ Q2 GDP
- Sep 20, Last: 0.5%, Westpac f/c: 0.9%, Mkt f/c: 0.8%
After a few quarters of patchy, subdued growth, the stars seem to have aligned for the New Zealand economy during the June quarter. Recent activity indicators have shown growth ranging from modest to strong across a wide range of sectors. We expect a 0.9% rise in GDP for the quarter.
In part, our forecast reflects some big one-off gains in particular services sectors that are unlikely to be repeated. However, there are also some temporary negatives. Shutdowns in fuel and methanol production will subtract around 0.2% from Q2 growth, but will boost Q3 growth by the same amount.
The Q2 result could have an important bearing on the Reserve Bank’s thinking, given its low expectation of 0.5% growth and its recent comments that it is nearing the trigger point for OCR cuts.


