
Highlights
- With the USMCA awaiting ratification and trade talks with China nearing conclusion, the U.S. administration has turned its attention to other trade imbalances. The European Union and Japan – partners that have maintained persistent merchandise trade surpluses – are next in the queue.
- U.S.-EU trade talks are kicking off in an antagonistic fashion, with the U.S. using the threat of auto and other tariffs related to Airbus subsidies as leverage. The EU, while open to negotiation on industrial goods, has vowed to end trade talks and retaliate if more U.S. tariffs follow.
- The relatively small amount of goods that are targeted by tariffs from either side, both those imposed and threatened thus far, are unlikely to cause significant economic disruption in either economy. However, from a U.S. perspective, economic impacts could prove more outsized in certain industries and states.
- The U.S. East Coast is more exposed to trade with the EU than the rest of the country, given a heavy reliance on imports. As a result, the region could experience a larger economic impact. Similar to U.S.-China trade risks, South Carolina’s large exposure in auto exports make it the state most at risk in the region from an escalation in the U.S.-EU trade tensions. Large exposures on the import front could lead to outsized impacts for other states such as Rhode Island and New Jersey.
- With tit-for-tat measures a favored strategy, trade skirmishes have the tendency to escalate. Critically, although the amounts targeted thus far are small, increased trade policy uncertainty, the blow to business and consumer confidence, and the potential for reduced cooperation in other parts of the relationship (i.e. political, strategic, security etc.) could prove more damaging to the domestic and global economies.
This year is truly shaping up to be the “Year of the Deal”. The USMCA free trade agreement is awaiting ratification by all three governments, and trade talks with China have progressed enough to spark optimism about a deal before the end of this quarter. The U.S. is now turning its attention to other large trade imbalances. Next in the crosshairs is the European Union (EU).
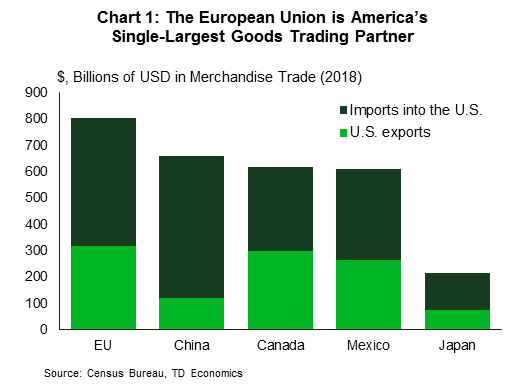
Over the last few years the U.S. has consistently run a goods trade deficit with the EU at around $150bn, or just under 1% of GDP. This is a smaller goods trade deficit than with China (about 2% of GDP), but still quite significant. The U.S. does not have a free trade agreement with the EU, and tariffs typically average below 3%.1 As the EU is its single-largest goods trading partner, the United States would likely benefit from a trade agreement (Chart 1).
Although the goal of the current U.S. administration is to reach a deal, negotiations are kicking off more antagonistically than cooperatively. New tariffs have been threatened on automobiles and other EU goods. By our calculations, a 25% tariff on motor vehicles and parts, with equivalent reciprocation from the EU, would only have a small direct impact on economic activity in each economy. But, the impact could prove much larger for each affected industry and economy after accounting for higher producer and consumer costs, the blow to confidence, and the hit to financial markets from an escalation in trade tensions.
As with the prior trade spat with China, not all U.S. regions would be affected proportionately by these tariffs. When using trade-to-GDP as a measure of exposure, East Coast states are relatively more exposed to disruptions from tariffs on trade with the EU, given a relatively high reliance on imports. As such, Rhode Island, New Jersey, South Carolina and Georgia appear to be the most dependent states on EU imports in the East Coast region (Chart 2).
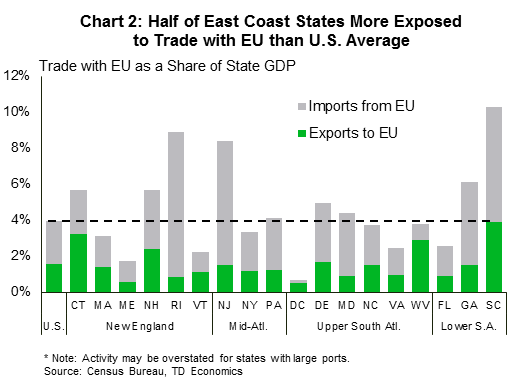
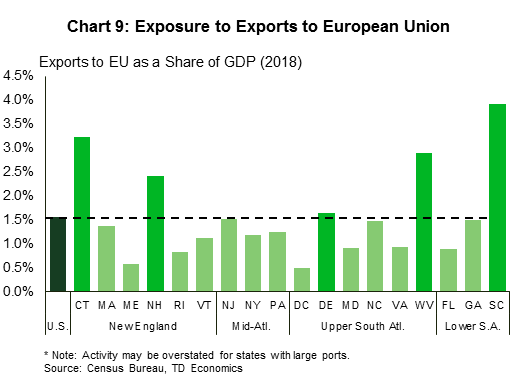
The East Coast is slightly less exposed on the export front. But even here, a few states within the region are more exposed than the U.S. average. These include South Carolina, the most dependent on the EU as an export market, followed by Connecticut, West Virginia and New Hampshire. Putting the two pieces together, a relatively higher share of overall trade with the EU points to larger direct impacts for South Carolina, Rhode Island and New Jersey, in the event of more protectionist measures being implemented.
U.S. trade with the EU is ‘huge’
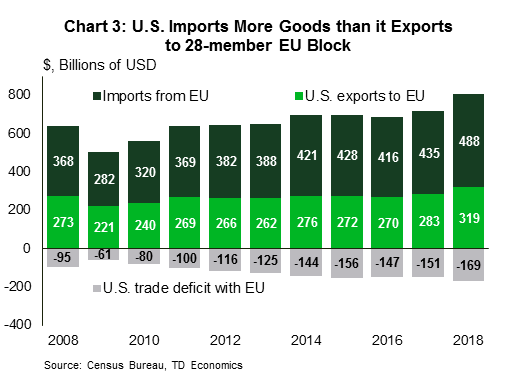
U.S. merchandise trade with the 28-member EU rose to $807bn last year, higher than that with China, Canada and Mexico.2 The U.S. exported some $318bn in goods to the EU last year, but imported about $487bn, resulting in a $169bn goods trade deficit (Chart 3). This trade deficit has persistent for the past two decades, raising the ire of the U.S. administration that is pushing for more balanced trade. On services, however, the U.S. maintains a small surplus of roughly $60bn, or 0.3% of GDP, with the EU.
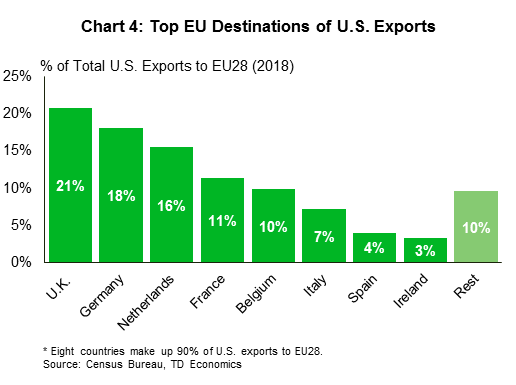
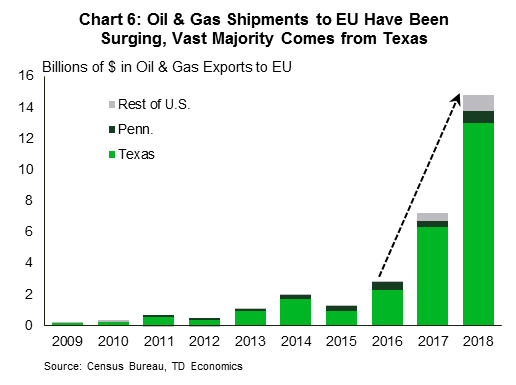
The top three EU export markets for U.S. goods are the UK, Germany, and the Netherlands (Chart 4). Merchandise exports are largely concentrated in manufactured goods (83.4%), followed by oil and gas and agricultural products. The bulk of manufactured goods are transportation related equipment (i.e. motor vehicles and parts and aerospace), followed by chemicals and computer and electronics (Chart 5). It’s important to note that although oil and gas exports comprise a small share of total exports at 6.4%, they are the fastest growing category of exports to the EU. Oil and gas exports to the EU quintupled from under $3bn in 2016 to nearly $15bn last year – the vast majority originating from oil and gas fields in Texas (Chart 6).

Agriculture and livestock product exports also had a strong performance in 2018, rising by 24% after a weak showing in the prior three years. Interestingly, the biggest push came from soybean exports, which nearly doubled from $1.7bn in 2017 to $3.1bn last year. Though politically sensitive, the agriculture & livestock category remains a very small player, accounting for only about 3% of total exports to the EU in the last five years.
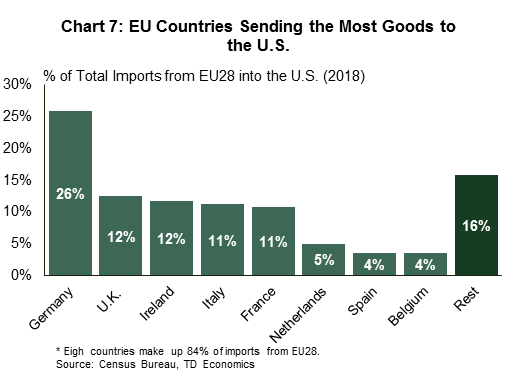
Similarly, U.S. imports from the EU are concentrated in manufactured goods, with transportation equipment, chemicals, computer & electronics, and machinery at the top of the leaderboard. Germany, the UK, and Ireland are the largest sources of imported goods (Chart 7).
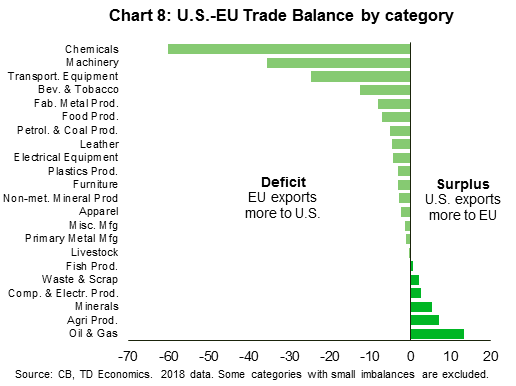
Within goods trade, the U.S. has surpluses in only a handful of categories such as oil and gas, agricultural products, minerals, and computers and electronics (Chart 8). Meanwhile, a large trade deficit persists in manufactured goods, led by chemicals, machinery and transportation equipment. The latter is made up mostly of motor vehicles and parts and aerospace. Within these two subcategories, the U.S. receives more motor vehicles and parts ($59bn, with a little less than half of this coming from Germany) than it sends to the EU. However, it does send more aerospace products to the EU ($47bn) than it receives ($28bn), with a small trade surplus in this subcategory.
U.S. fired the first tariff at the EU last year
Although tariff rates from both sides have fallen to average below 3% over the past few decades, they vary widely by product. Some tariffs are in the double digits, such as the EU’s 10% tariff on U.S. motor vehicle imports and 12-15% typical tariffs on agricultural goods3, or the 25% tariff on all truck imports that the U.S. has had in place since the 1960s.4 Major non-tariff barriers, such as stricter agri-food standards in the EU and differences in vehicle safety standards, are also obstacles to trade.
Trade tensions between the two economies ramped up early last year when the U.S. announced tariffs on EU aluminum and steel product imports. Shortly after those tariffs went into effect in June 2018, the EU responded by imposing tariffs on around $3bn in annual U.S. imports, which encompassed well known products like Harley Davidson motorcycles and bourbon.
Then, last May, the U.S. administration initiated an investigation into motor vehicle and parts imports under national security grounds (S. 232 of the U.S. Trade Expansion Act), the same grounds used to generate a report that recommended tariffs on steel and aluminum imports. The recommended actions by the Office of the U.S. Trade Representative were reported to the U.S. administration in mid-February, but have not yet been made public. While action can be delayed, as a first pass, the administration has until May 18th to act on the findings of the report, hence the urgency to kickstart trade talks.
In the past, President Trump threatened to impose a 25% tariff on all motor vehicle and parts imports, but recently that rhetoric has diminished. Instead, the U.S. administration has emphasized the unequal tariff treatment of motor vehicles between the EU and U.S., with the former levying a 10% tariff on imported U.S. autos, compared to just a 2.5% tariff on EU autos imported into the U.S..
The long-running fight at the WTO regarding unlawful subsidies given to Airbus and Boeing has served to fuel trade tensions further. The U.S. is considering implementing tariffs on European products worth some $11.2bn in relation to the Airbus subsidies.5 On the other hand, last month the WTO found that U.S. subsidies to Boeing had also violated WTO trade rules. Following this ruling, the EU released a list of U.S. products worth some $20bn, ranging from chemicals, aircraft and agri-food products, on which the EU may take action on in response to the Boeing subsidies.6
Threatened tariffs to have small direct economic impacts
As is typical with estimating real economy impacts from tariffs, results vary on the techniques and assumptions employed. In this case, the value of the goods in question are quite small: $59bn in automotive imports from the EU in 2018, good for 0.3% of GDP. As a result, even a tariff as high as 25% on more than $50bn in imports, followed by reciprocation by the EU, is unlikely to have a significant direct economic impact on the U.S. or EU economy. Indeed, impact analysis derived from trade literature suggests that the direct damage to the U.S. economy from tariffs will amount to less than a tenth of a percentage point on economic growth.7
Although the direct trade disruption may be small, estimates by the Center for Automotive Research (CAR) suggest that a 25% tariff on all imported vehicles and parts may raise average car prices by $4,400 on average.8 Imported cars could see prices increase by up to $6,800, and domestically produced vehicles could see prices rise by $2,300. This is likely to boost inflation by one to two tenths of a point. Moreover, they estimate that about 700k jobs, or 0.4% of the employed population of the U.S., could be at risk if the tariffs are imposed.
What’s more, while the national impacts may be small, regional U.S. economies may be hit harder due to outsized exposure to EU as a destination and source for products and inputs.
East Coast export exposure to EU limited
Data limitations aside, only a handful of states on the East Coast have materially higher export exposure than the U.S. average to the EU. These include South Carolina, West Virginia, Connecticut and New Hampshire. Four states, Delaware, New Jersey, North Carolina and Georgia, are right in line with the U.S. average, with all other East Coast states notably below this threshold (Chart 9).
The more exposed states are heavily reliant on a single export category, an important detail because the economic hit from tariffs ultimately relies upon what products are targeted by retaliatory tariffs. For instance, West Virginia’s exports to the EU are heavily concentrated in minerals and ores, while Delaware is tilted toward chemicals, with each category making up two thirds of total exports to the EU in each state. Similarly, Connecticut and South Carolina are heavily reliant on transportation equipment, with the latter accounting for about two-thirds of exports to the EU in each. To a lesser degree, transportation equipment plays an important role in New Hampshire, making up about a third of its total exports to the EU.
East Coast transportation equipment exports to the EU
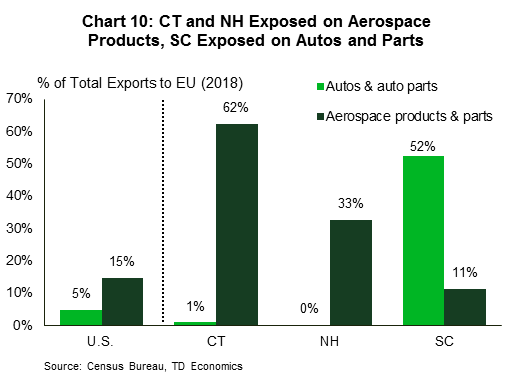
Digging deeper in the transportation equipment category reveals that exports of aerospace products play a much larger role in Connecticut and New Hampshire, while autos are more significant in South Carolina (Chart 10). This isn’t surprising given the type of manufacturing undertaken in these states.
New Hampshire, for instance, is home to companies such as GE Aviation in Hooksett, which manufactures components for jet engines, and Titeflex Aerospace in Laconia, which produces aerospace hoses and fittings. Connecticut, meanwhile, is the home to Pratt and Whitney, a major producer of airplane engines. Interestingly, France, which ranks as Connecticut’s number one EU export market, is a big customer of P&W products, with high demand from aerospace giant (and Boeing rival) Airbus. Other Connecticut companies affiliated with Airbus include Kamatics (aerospace plain bearings), and Hexcel (advanced materials). This suggests that the new planned tariffs on $11.2bn worth of EU goods, which include aerospace products, have the potential to cut both ways, particularly if the EU retaliates in kind.
In terms of motor vehicle production, South Carolina’s economy is home to BMW’s only U.S. factory, which produces vehicles such as X3, X5 and more recently X7. BMW’s Spartanburg plant is the biggest U.S. automotive exporter by value, with worldwide exports coming in at $8.4bn in 2018. The vast majority of the exported vehicles pass through the port of Charlestown, providing an added benefit to the region. With BMW as a major contributor, statewide motor vehicle exports to the EU totaled $4.2bn last year, which accounts for almost a third of all U.S. auto exports to that market. This makes South Carolina the biggest auto exporter to the EU, dwarfing all other East Coast States (Chart 11). The trend is expected to continue, with a new Volvo plant in Ridgeville now exporting the S60 model to Europe.

As with aerospace, the auto industry is highly globally integrated, with components sourced from across the world, often crossing borders multiple times. For instance, BMW imports the engines and transmissions used in its South Carolina vehicles from plants in Europe. As South Carolina is the biggest U.S. auto exporter by far, tariffs have the potential to disrupt the state’s economy.
The protectionist measures being contemplated are expected to weigh on domestic sales and exports, while boosting prices. But tariffs aren’t devoid of opportunity entirely. With the U.S. a net auto importer, some production can shift domestically. Mercedes-Benz for instance, recently opened a factory in South Carolina to produce Sprinter vans for the U.S. market. Previously, the automaker had gone to extreme lengths to avoid the 25% Chicken Tax, by first building the vans in Germany, then stripping them to their parts, shipping them to South Carolina and reassembling them. BMW is now also considering a second major U.S. plant for engines and transmissions.
East Coast more dependent on imports from EU
While the East Coast region is slightly less exposed relative to the rest of the U.S. on exports, the opposite is true on the import front. Goods coming in from the EU last year were the equivalent of nearly 3% of the region’s GDP, versus a little over 2% for the rest of the country (Chart 12). What’s more, this theme is fairly spread out across the region, with half of all East Coast states more exposed than the U.S. average. This suggests tariff-induced supply chain disruptions in key sectors could prove more detrimental via the import channel than exports.

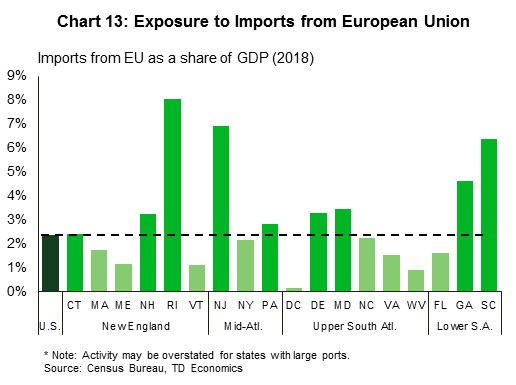
Among East Coast states, Rhode Island appears to be most exposed. The small northeastern state with a gross domestic product of a little over $61bn received nearly $5bn worth of goods from the EU last year, with imports-to-GDP a staggering 8% – more than triple the U.S. average. New Jersey, South Carolina and Georgia are next in line, at roughly 7%, 6.5% and 4.5% respectively (Chart 13).9
At the national level, the main trade categories are the same as on the export side, with transportation equipment, chemicals, computer & electronics, and machinery still at the top of the leaderboard. But, import intensity is relatively higher in chemicals – the bulk of this being pharmaceuticals – and machinery. At the state level however, imports are less diversified, with states (again) heavily reliant on a single import category.
Among the eight overexposed states, chemicals play a large role Delaware, New Jersey and Pennsylvania, with transportation equipment the main element behind the outsized exposure of the remaining states. Within transportation equipment, aerospace is the most significant component only in New Hampshire, while autos play a larger role in Rhode Island, Maryland, Georgia and South Carolina. It’s important to remember that these states all have large-capacity ports, which allows them to import the high value-added product (automobiles) en masse. This facilitation, however, comes at the cost of distorting import figures for East Coast states (Box 1).
Box 1: Trade data limitations
State trade data has some important limitations. On imports, the Census Bureau warns that in some cases, the ‘destination state’ may in fact reflect an “intermediary, storage or distribution point” rather than the final destination of the goods imported. An example of this is a consolidated car shipment that is first sent to a seaport state, with the cars subsequently to be distributed across the U.S. for sale. This example appears to be playing out across the East Coast, given that the region features multiple large seaports.
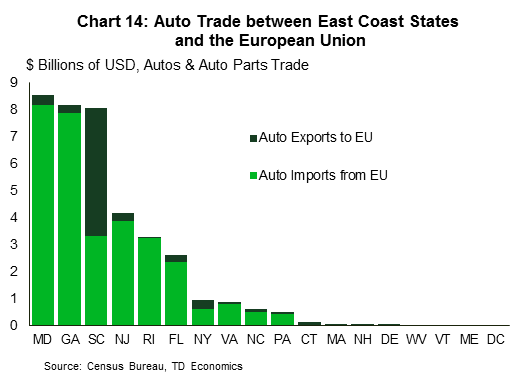
The Port of Baltimore (MD) and Brunswick (GA) for instance, rank among the nation’s top ports for auto imports. Auto imports from the EU into Maryland and Georgia, which have populations of 6.0 and 10.5 million respectively, came in at around $8bn last year (Chart 14). By comparison, auto imports in New York, whose population is close to 20 million, totaled only $0.64bn. Clearly, Maryland’s and Georgia’s figures are being overstated, with these states also acting as a distribution hub for autos. That said, in the event of a ramp up in tariffs, supply chain disruptions would weigh on seaport activity – typically an important contributor to economic activity, especially for smaller states. So the exposure numbers considered in this report, still serve as an important risk indicator.
Similarly, on exports, in certain cases, the origin of movement may reflect a consolidation point, rather than the true origin of the goods. Distortions on the export front are pronounced for agricultural shipments. For direct Census Bureau explanations, see here.
Threat of escalation the biggest concern
Although both sides are keen on working toward a trade agreement, there is little scope to be too optimistic from the get go. The U.S. is pushing for an agreement that opens the door to greater agricultural goods exports to Europe, which the EU refuses to consider. Instead, the EU is focusing only on a zero-for-zero tariff deal on industrial products. What’s more, the European Commission has been given an explicit directive to cancel talks if the U.S. imposes additional tariffs. This stalemate points to a collision course. Other elements add to the collision trajectory. This month, the U.S. administration announced it is taking a harder stance on Cuba, by allowing lawsuits against foreign companies connected to properties seized during the 1959 Cuban revolution. Several European countries, such as the UK, France and especially Spain, have companies operating on the island, and the EU has vowed to protect their interests. Other stumbling blocks include France’s unwillingness to negotiate trade with countries not part of the Paris climate agreement, and the fact that the EU is asking for the removal of steel and aluminum tariffs.
Escalating trade tensions between the U.S. and China last year seemingly caused limited direct economic damage. However, trade-related policy uncertainty spiked around the world, sending confidence, global trade volumes, and business investment lower. These second-order effects appear large enough to have been partly responsible for the recent slowdown in global economic growth to a sub-trend pace. A similar impact can be expected from a widened U.S.-EU trade conflict.
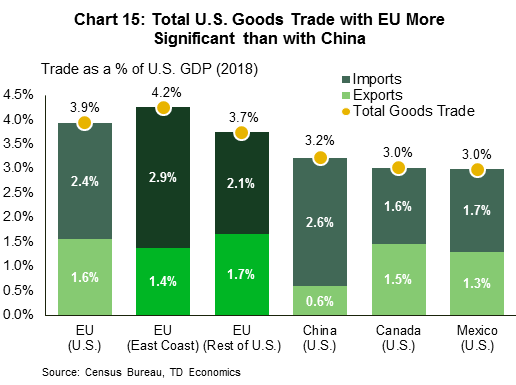
In the case of China, tariffs from both sides eventually encompassed $350bn in two-way trade. On the other hand, U.S.-EU tariffs already implemented and those that are being considered, would only amount to a maximum of $125bn (see Table 1). Still, with tit-for-tat measures typically a favored strategy, trade skirmishes have the tendency to snowball. The U.S.-EU relationship features a larger trade flow ($807bn or the equivalent of 3.9% of U.S. GDP) than U.S.-China ($660bn or the equivalent of 3.2% of U.S. GDP; Chart 15). Therefore, it is not inconceivable for an escalation in the U.S.-EU trade spat to wipe out the recent positive global growth momentum spurred by stimulus measures around the world.
Perhaps more critically is the potential longer-term damage that deteriorating trade relations can have on the many alliances between the two economies. Global institutions and defense treaties have relied on cooperation between the U.S. and European economies for decades. An economic rift could expose other disagreements, threatening to fuel even greater global political and economic uncertainty at a time when the global economy is in a delicate place.
End Notes
- Trade negotiations on the Transatlantic Trade and Investment Partnership (TTIP), a U.S.– EU trade agreement, came to a halt in 2017, following the election of Donald Trump as U.S. President. The agreement intended to eliminate tariffs on up to 97% of all goods imported by the EU from the U.S. However, tariffs are likely to remain on most agricultural goods. Currently, tariffs average below 3% as per European Commission, see: http://ec.europa.eu/trade/policy/countries-and-regions/countries/united-states/
- We include the UK as part of the EU despite its plans to leave the block. The Brexit process remains highly uncertain in terms of timing and trading relationship post Brexit. An ultimate exit of the UK from the EU also remains questionable.
- EU tariffs on agricultural imports often include both a percentage and a fixed cost per unit. See Annex 1 (updated January 2019) of EU Council Regulation No. 2658/87 on the tariff and statistical nomenclature and on the Common Customs Tariff for a detailed list of EU tariff rates, https://eur-lex.europa.eu/legal-content/EN/TXT/?uri=CELEX:32018R1602
- A 25% tariff on all truck imports, known as the “Chicken Tax”, was imposed in 1963 in retaliation for similar sized tariff imposed by West Germany and France on chicken imports from the United States.
- USTR press release and preliminary product list: https://ustr.gov/about-us/policy-offices/press-office/press-releases/2019/april/ustr-proposes-products-tariff
- Press release from the European Commission: http://europa.eu/rapid/press-release_IP-19-2162_en.htm
- This is supported by new research that estimates direct damage to the U.S. economy from tariffs last year on more than $300bn in U.S. imports, and $96bn of U.S. exports, of about four tenths of a percentage point. This research suggests that the impact of tariffs has been largely borne by producers via higher input prices. It also focuses strictly on direct trade impacts along the global supply chain, avoiding any discussion on the potential impact of increased global trade policy uncertainty, reduced confidence, or negative wealth/stock market effects due to the tariffs. Source: Fajgelbaum et al (2019). “The Return to Protectionism”. NBER Working Paper as at March 10, 2019, http://www.econ.ucla.edu/pfajgelbaum/RTP.pdf
- Center for Automotive Research, September 15, 2018, see: https://blog.nada.org/2018/09/25/center-for-automotive-research-study-shows-auto-tariffs-leading-to-dramatic-vehicle-price-increases-job-losses-and-economic-consequences/
- Given that state-level trade data has some notable limitations (see Box 1), it is important to take these figures with a grain of salt.


