Chinese stocks declined while US futures rose as traders interpreted various news from the US and China. On Friday, the Wall Street Journal reported that the US was considering banning any investments in the US. The administration was also considering delisting Chinese companies that were listed in the US. On Sunday, the US Treasury Department said that it was not considering doing the two for now. Still, this threat will continue being around since it has not been ruled out completely. Such plan would be disastrous for the markets because Chinese stocks are currently worth more than $1 trillion. Most of their holders are American pension and investment firms.
Earlier today, China released manufacturing and services PMI data. According to a survey of large manufacturers by Markit, the manufacturing PMI increased slightly from 49.5 to 49.8 in September. This was a bigger increase than the 49.5 that traders were expecting. It was the fifth straight month of contraction. Another survey from Markit showed that the manufacturing PMI increased to 51.4 from the previous 50.4. Still, the PMI numbers imply that the Chinese manufacturing sector is not doing well. The services PMI for September was 53.7, lower than the previous 53.8.
Later today, traders will receive construction PMI and housing starts PMI data from Japan. This will come a few hours after the country released positive retail sales numbers. From Europe, traders will receive the Spanish CPI and GDP data. From Germany, they will receive unemployment data. The unemployment rate is expected to remain unchanged at 5.0%. From the UK, they will receive the final readings of the second quarter GDP data. They will also get data on mortgage approvals. From Canada, traders will receive the Raw Materials Price Index (RMPI and Industrial Product Price Index data.
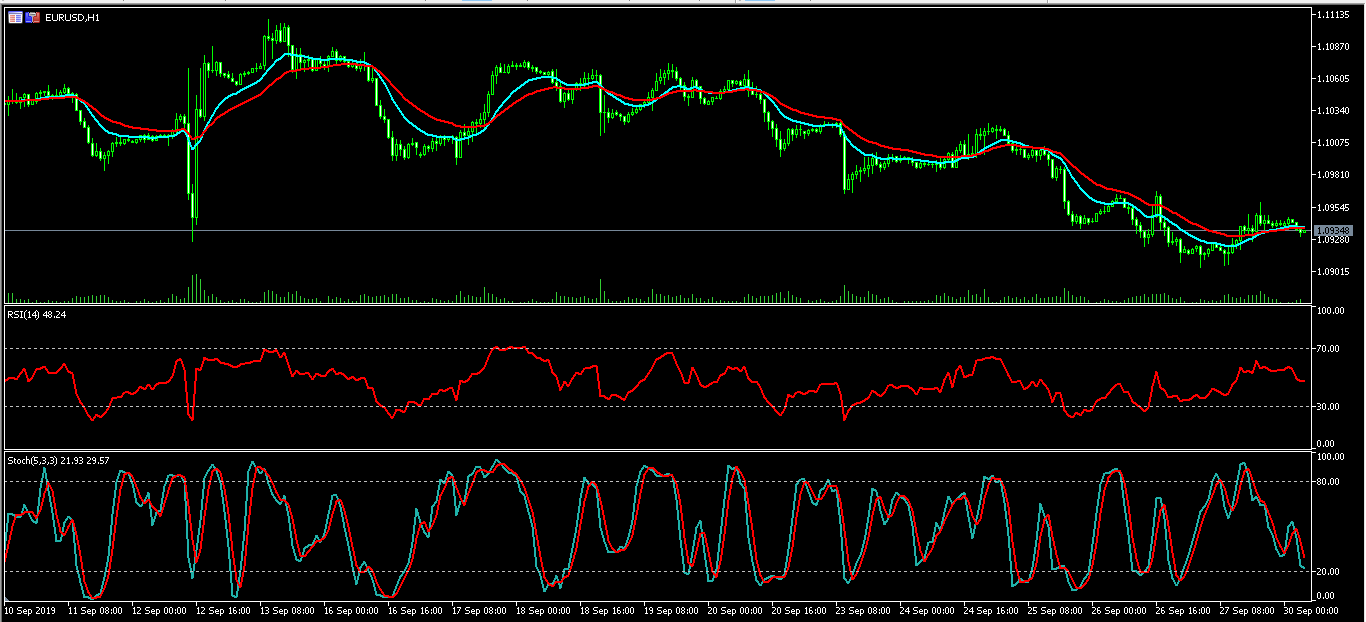
EUR/USD
The EUR/USD pair is trading at 1.0934, which is slightly lower than Friday’s high of 1.0960. On the hourly chart, this price is slightly below the 14-day and 28-day moving averages. The RSI has moved slightly lower to the current low of 48 while the signal and main lines of the Stochastic oscillator have moved to the oversold level. The pair could see some major movements in either direction as traders receive European data.
USD/JPY
The USD/JPY pair was relatively unchanged after the country released important economic data. The pair is now trading at 107.90, which is slightly lower than Friday’s high of 108.17. On the hourly chart, the current price is along the 61.8% Fibonacci Retracement level. It is also along the middle line of the Bollinger Bands while the momentum indicator has moved to below the 100 level. The average true range has also started moving up. The pair will likely continue move higher to retest the important resistance level of 108.17.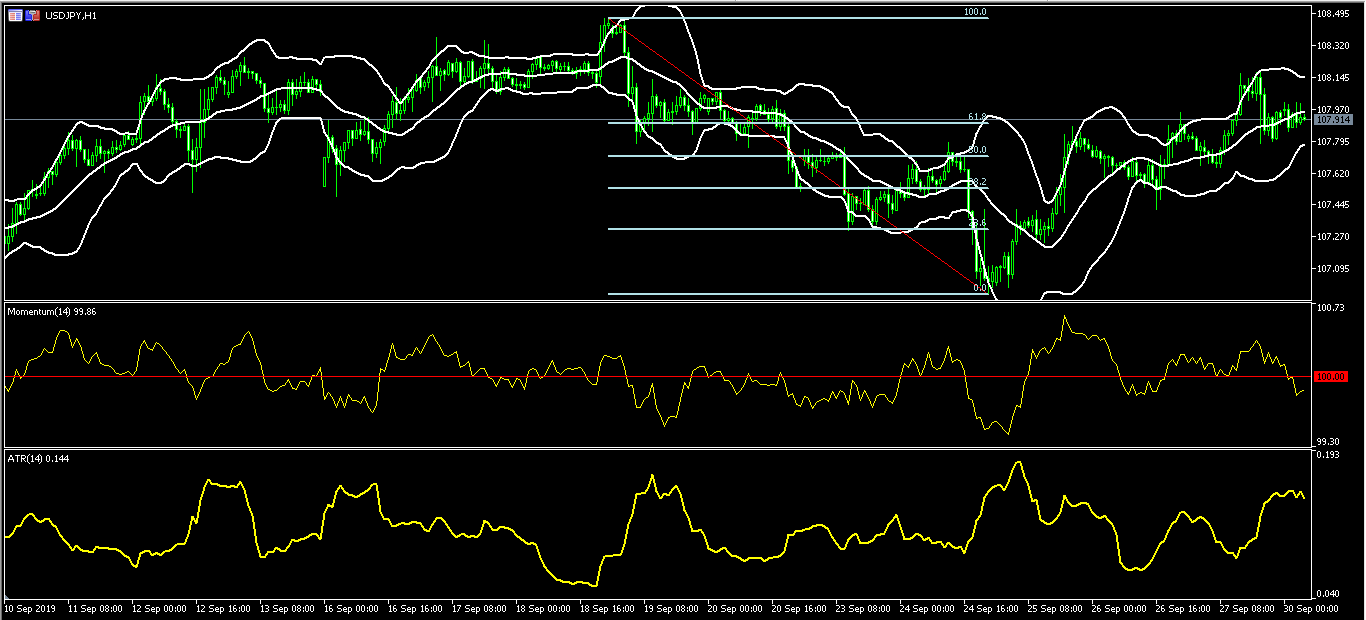
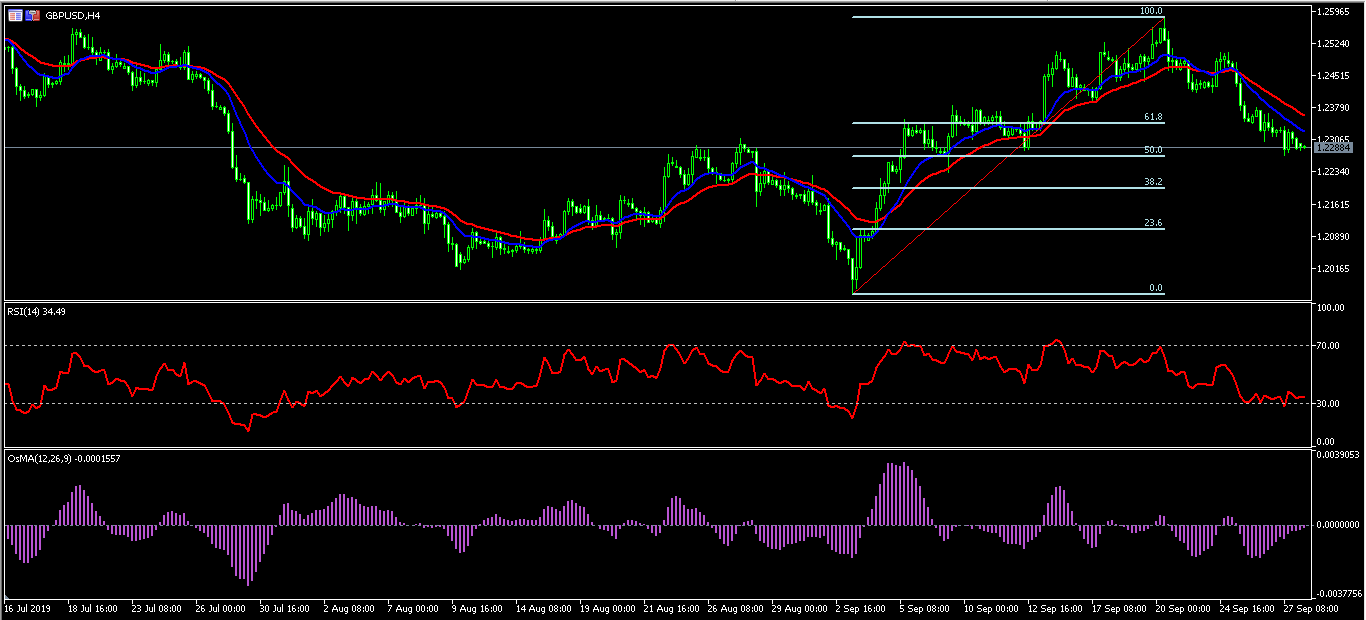
GBP/USD
The GBP/USD pair has been on a sharp downward decline since Friday when it reached a high of 1.2580. Today, the pair reached a low of 1.2270, which is along the 50% Fibonacci Retracement level. The price is below the 14-day and 28-day moving averages while the RSI has dropped to the oversold level. The oscillator of moving average has remained in the oversold side. The pair will likely continue moving lower.