The Japanese yen weakened slightly after the country released spending data for August. In the month, household spending increased by 2.4%. This was lower than the consensus estimates of 2.8% but higher than the July decline of -0.9%. On a YoY basis, the spending increased by 1.0%, which was lower than the consensus estimates of 1.2%. The average cash earnings dropped by -0.2% while the overall wage income of employees declined by -0.2%. Meanwhile, the current account increased to Y2.15 trillion from the previous Y2.0 trillion.
Asian stocks rose even after the Trump administration continued trade war rhetoric. Overnight, the US added 28 Chinese firms to an export blacklist for their role in Beijing’s repression of Muslim minorities in Northwest China. The US said that the decision was not in any way related to the ongoing trade war. However, it will be viewed as a sign of bad faith by the Chinese as trade talks are set to restart this week. Still, expectations for this round of talks are low because investors don’t believe there will be concessions. In Australia, the ASX 200 index rose by 26 points while in Japan, the Nikkei rose by 218 points.
Later today, traders will listen to the Bank of England’s Governor, Mark Carney and the Fed’s Jerome Powell. In Switzerland, they will receive the unemployment numbers while in France, they will receive the exports and imports. In Sweden, they will receive the industrial production data while in Italy, they will receive the retail sales. In the United States, they will receive the producer prices data. The core PPI is expected to have remained unchanged at 2.3%. On a MoM basis, the core PPI is expected to decline from 0.3% to 0.2%. The headline PPI is expected to have remained unchanged at 1.8%.
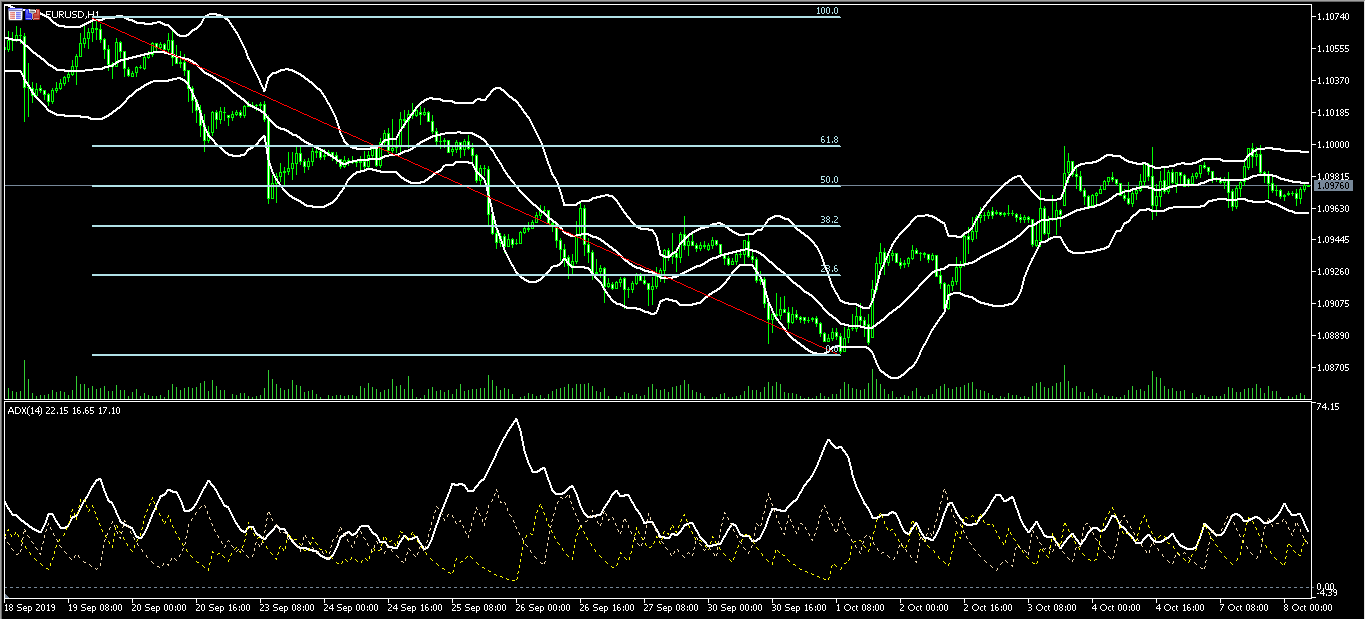
EUR/USD
The EUR/USD started an upward trend on October 1 when the pair was trading at 1.0878. The pair reached a high of 1.1000 where it has found significant support. The pair is now trading at 1.0975, which is along the 50% Fibonacci Retracement level. The price is along the middle line of the Bollinger Bands while the average directional index has declined to 22. There is a possibility that the pair will continue moving higher.
USD/JPY
The USD/JPY pair rose to a high of 107.40 after Japanese data was released. On the hourly chart, this price is between the 50% and the 38.2% Fibonacci Retracement level. The price is slightly lower than the upper line of the Bollinger Bands while the momentum indicator has increased to the highest level in months. The Chaikin oscillator has moved above the neutral line. The pair could continue moving higher to the 50% Fibonacci retracement level of 107.50.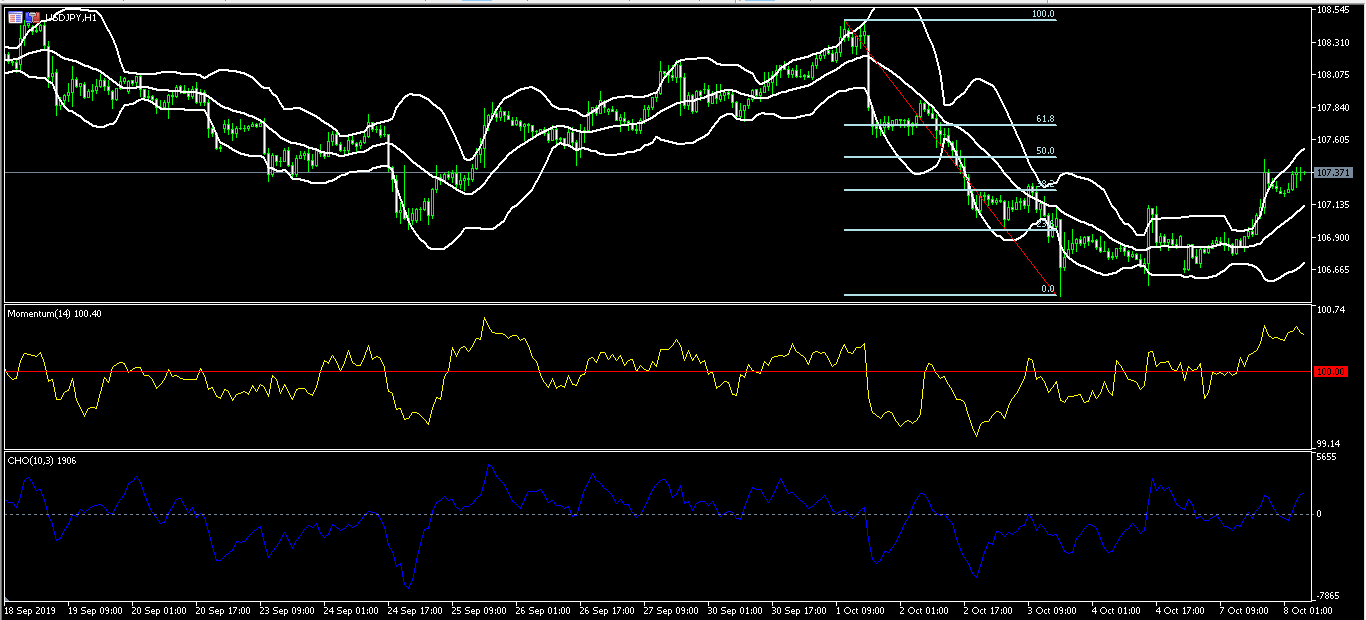
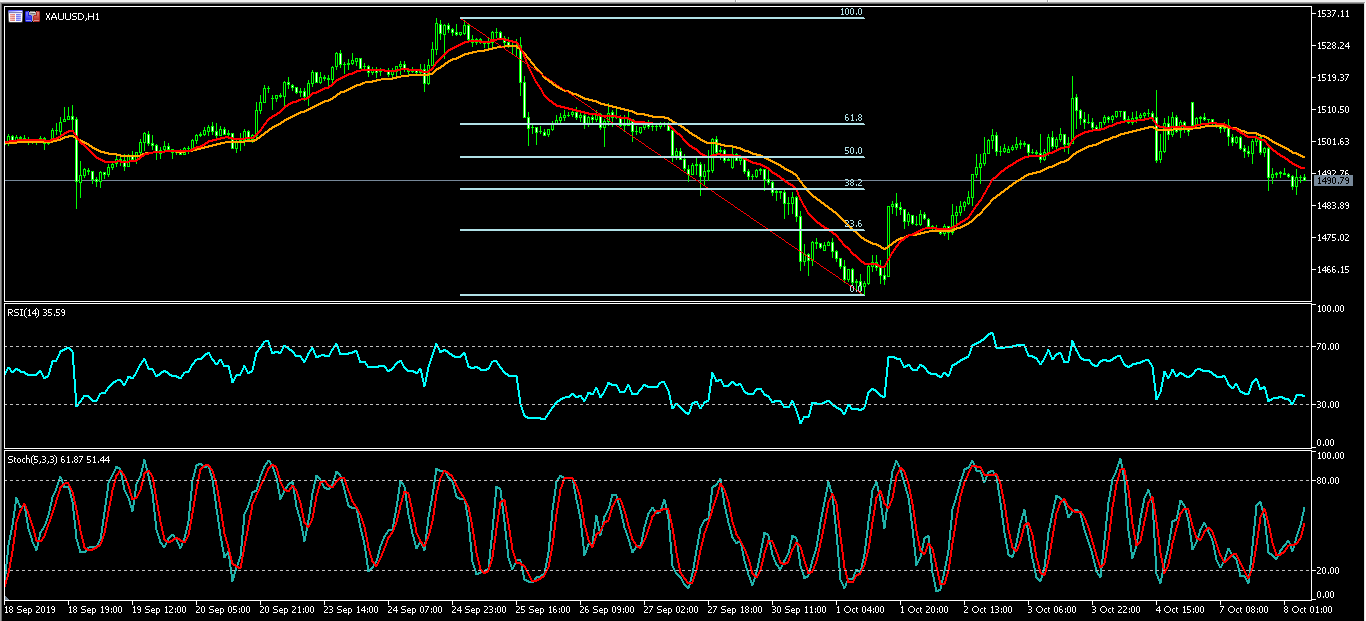
XAU/USD
The XAU/USD pair has been declining and is currently trading at 1491.10. On the hourly chart, the pair is trading below the 14-day and 28-day moving averages while the RSI has been falling as well. The main and signal lines of the Stochastic Oscillator have been moving higher. It is likely that the pair will continue moving lower to test the 23.6% Fibonacci Retracement level of 1477.22.