
U.S. Review
Expansion Poised to Continue into the Next Decade
- President Trump became the third president in U.S. history to be impeached by the House, but removal by the Senate is highly unlikely. The House also passed the USMCA, which should be signed into law in early 2020. This, along with the phase one deal announced last Friday, should remove some uncertainty as we head into the new year.
- Boeing announced it is halting production of the 737 MAX. We estimate this will drag 0.5 points off Q1 GDP growth.
- November industrial production jumped, but it was largely due to GM resuming production post-strike. Residential activity continues to post solid gains.
Expansion Poised to Continue into the Next Decade
A relatively quiet week for hard economic data was nonetheless full of new developments. First, President Trump became the third president in U.S. history to be impeached, after the House voted 230-197 and 229-198 along strictly partisan lines to charge him with abuse of power and obstruction of Congress. Despite the historic nature of the vote, there was negligible reaction from financial markets. Trump joins Bill Clinton (1998) and Andrew Johnson (1868) as impeached presidents, but, like both of them, he will most likely not be removed from office, as the Republican controlled Senate has shown no signs of breaking rank. The economic impact should thus be small to none. Modestly positive, however, in the form of lower trade policy uncertainty, is the progress on the USMCA trade agreement. One day after voting to impeach, the House agreed overwhelmingly to approve the trade pact, which is expected to be passed by the Senate and signed into law early next year.
Second, Boeing announced on Monday it would halt production of the 737 MAX, which it was currently producing at a rate of 42 per month but not shipping. We estimate the suspension of production will reduce Q1 GDP growth by as much as 0.5 percentage points, with hits to manufacturing output, inventories building and eventually to payrolls up and down the supply chain. For more on when we expect a rebound, see Topic of the Week.
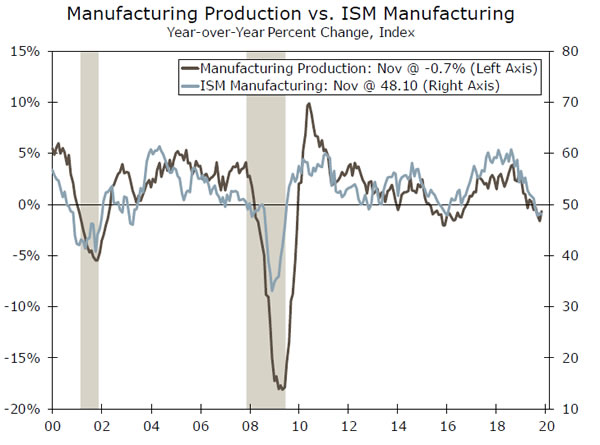
We will be closely watching the industrial production data, which showed a 1.1% jump in November, the highest since October 2017. This was due almost entirely to the 12.4% surge in motor vehicles & parts output, as striking GM employees returned to work during the month. With troubles at two of America’s manufacturing giants injecting idiosyncrasies into the month-to-month data, it can be easy to lose the forest for the trees. Stepping back, however, what’s clear is the factory sector has moved sideways this past year— output is down 0.7%—under the cloud of trade uncertainty. Third, the agreement on the phase one trade deal between the United States and China, which was announced by the U.S. Trade Representative last Friday, lifts some of that uncertainty.
Moreover, the nascent rebound in the ISM signals coming improvement for manufacturing (top chart). Still, we do not have perfect clarity on the deal; for example, is China really going to buy $50 billion of U.S. agricultural products annually when it has never purchased even $25 billion in a year, even before the trade war started? Nevertheless, the lowering of tariffs and rhetoric should improve the economic environment and is why we changed our forecast this week and now have the Fed on hold in 2020.
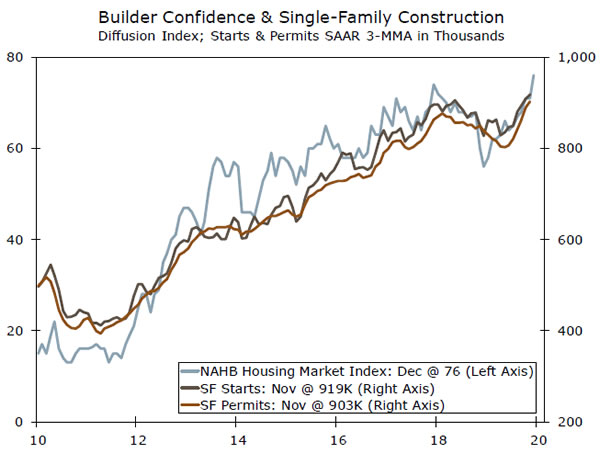
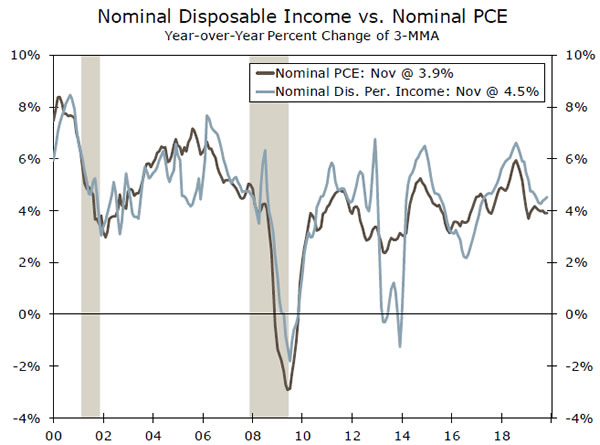
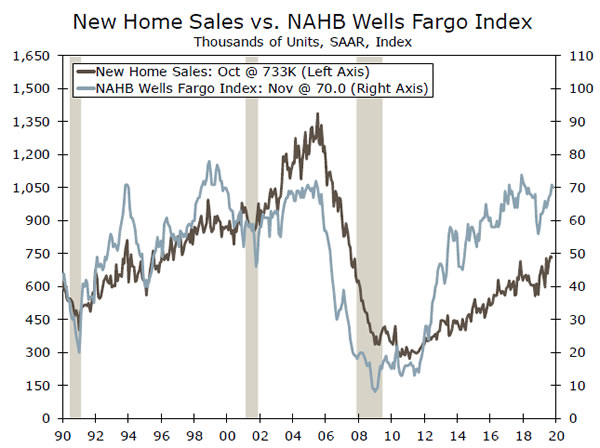
Outside of Washington, D.C. and Seattle, Main Street and the housing sector are picking up, benefiting from the sizable move down in interest rates this past year. The NAHB index soared five points to 76, the highest since 1999, and housing starts followed suit, climbing 3.2% in November (middle chart). Existing home sales disappointed with a 1.7% drop, but surging builder optimism, sustained low rates and solid consumer fundamentals (personal income rose 0.5% in November, while personal spending rose 0.4%, bottom chart) should drive housing higher in 2020.
U.S. Outlook
New Home Sales • December 23
Despite slipping in October, new home sales have been on a tear recently, averaging their fastest three-month pace of this expansion. Three quarter-point rate cuts by the FOMC over the second half of the year helped ease borrowing costs for builders. Potential home buyers have also enjoyed cheaper financing, which, along with a resilient labor market and changing demographics, has supported demand for new homes. For the first time in a few years it appears the housing market has the wind at its back, and we expect these dynamics will support continued improvement in the housing market going into 2020.
As for the penultimate month of the decade, existing home sales took a step back, but surging builder optimism suggests to us that the pace of new home sales increased marginally in November.
Previous: 733K Wells Fargo: 734K Consensus: 730K
Durable Goods • December 23
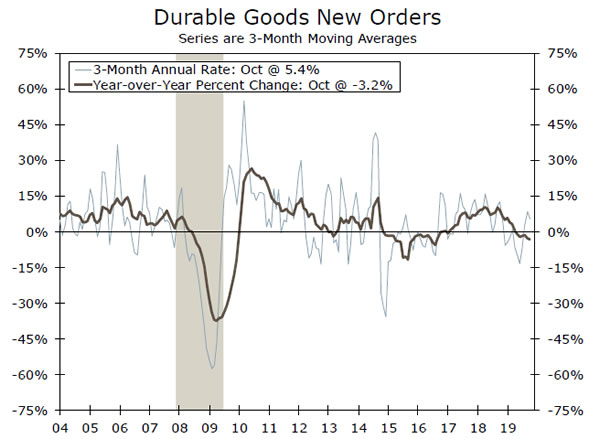
The October durable goods report showed signs of stabilization in the manufacturing sector following a rough few months. Core capital goods orders, which rose 1.1%, suggested that the rebound was more than just a one-off, but continued weakness in the survey measures suggests that any rebound in the industrial sector is likely to be muted.
Looking to the November report, the resolution of the GM strike means we should be due for some bounce back in motor vehicle & parts orders in November. Motor vehicles & parts orders declined 2% in October, following a 2.9% decline the month prior. By our calculations, a full rebound in orders for this category would add a little more than a percentage point to the headline figure. But, with activity remaining under pressure outside the auto sector, we are looking for just a 1.3% increase in durable goods and a 0.2% increase in durables ex-transportation.
Previous: 0.5% Wells Fargo: 1.3% Consensus: 1.5% (Month-over-Month)
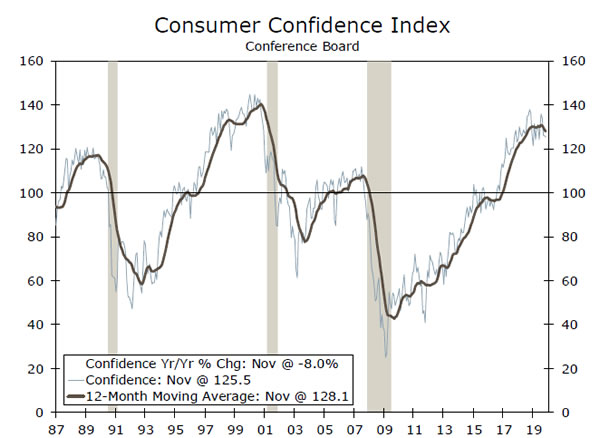
Consumer Confidence • December 31
The Conference Board’s Consumer Confidence Index fell for the fourth straight month in November to 125.5, driven by a 6.6 point drop in consumers’ assessment of current business and labor market conditions. This streak of declines could turn around following the de-escalation of trade tensions and subsequent stock market rally. However, the full effect of a U.S.-China ceasefire might not be realized yet, given that the agreement and its effect on sentiment took place toward the end of the board’s survey period. Even still, our above-consensus call looks for the index to recoup more than its losses over the last three months. More broadly, we anticipate that consumer confidence will remain in the elevated range that it has maintained over the past two years. While economic and political uncertainty continues to weigh on the economy, employment gains should give consumers plenty of reason to remain upbeat.
Previous: 125.5 Wells Fargo: 129.4 Consensus: 128.0
Global Review
Chinese Data Better, Eurozone Mixed, Banxico Cuts
- The international economic data started the week on a positive note, as data out of China showed a broadly encouraging picture for November.
- The preliminary Eurozone PMIs for December were more mixed. The manufacturing sector PMI gave back November’s gain, but the service sector PMI resiliently remained in expansionary territory.
- Both the Bank of England and Bank of Mexico met this week, with the former keeping rates steady and the latter cutting its main policy rate 25 bps, the fourth time it has done so this year.
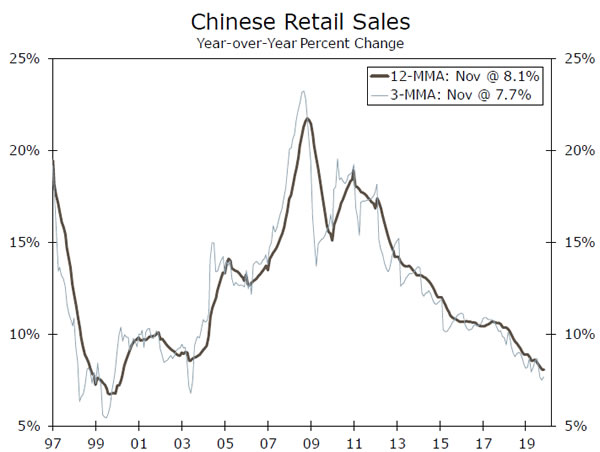
Chinese Data Better, Eurozone Mixed, Banxico Cuts
The international economic data started the week on a positive note, as data out of China showed a broadly encouraging picture for November. Chinese retail sales accelerated to their fastest pace since June, as did industrial production (see chart on front page). This was an especially encouraging string of prints, as the recent détente in U.S.-China relations offer some reason to believe that the November momentum might be carried into 2020. We published a report earlier this week arguing that the recent performance of some China-dependent economies suggests the world’s second largest economy may be starting to stabilize, and this week’s data provide further evidence for this view.
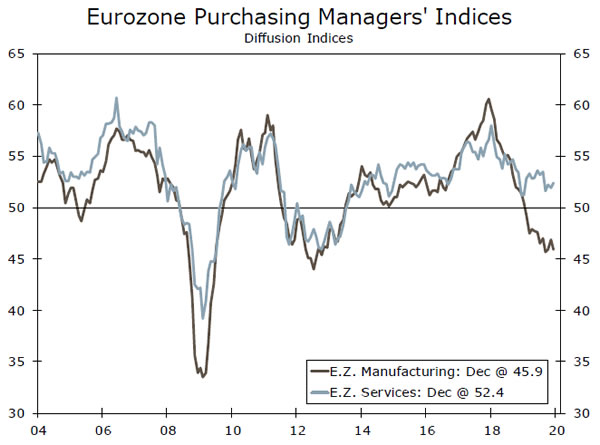
The preliminary Eurozone PMIs for December were more mixed. The manufacturing PMI gave back the one point gain seen in November, returning to its October level of 45.9 (top chart). With this print, the Eurozone manufacturing PMI spent 11 of the 12 months in 2019 below the 50 line that demarcates expansion from contraction. Thus, the theme of weak manufacturing in Europe appears to have remained in place to finish the year. Yet, the other major theme of service sector divergence also appears to have remained in place, as the Eurozone services PMI rose half a point to 52.4. Despite the manufacturing sector’s troubles, the service sector has remained resilient, and at no point has it fallen below 51.2 this year. Yet another quarter of relatively weak but positive growth appears likely for the Eurozone in Q4-2019.
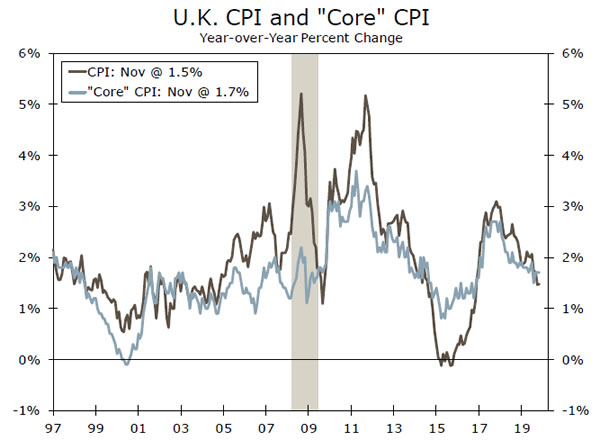
The Bank of England (BoE) met this week on the heels of the U.K. general election that gave Boris Johnson’s conservative party a majority in parliament. The central bank chose to hold its policy rate steady, and noted in its statement that “GDP growth was projected to pick up from current below potential rates, supported by the reduction of Brexit-related uncertainties, an easing of fiscal policy and a modest recovery in global growth.” Interestingly, the BoE argues that continued strong pay growth and relatively weak productivity growth point to unit labor cost growth that is consistent with inflation above target over the medium term. In the near term, the ongoing strength in the pound is likely to keep a lid on inflation, which has retreated from nearly 3% over the past year or so (middle chart). We do not expect the BoE to hike or cut rates in 2020.
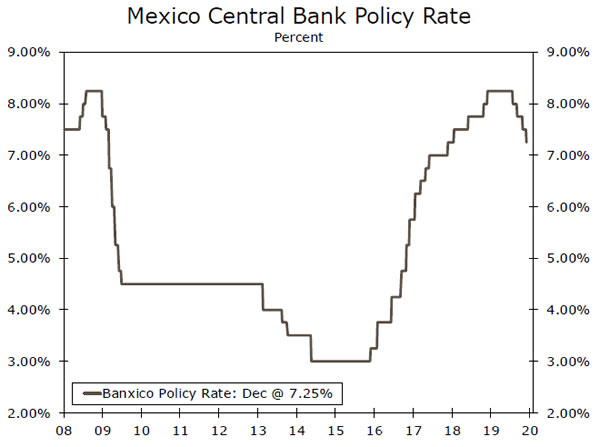
The Bank of Mexico also met this week, and chose to once again cut rates 25 bps. Since the start of the year, the central bank has cut its main policy rate 100 bps (bottom chart) amid an environment of slowing inflation and real GDP growth that is -0.3% year-over-year at present. The anticipated passage of the USMCA should be a net positive for the Mexican economy and the peso, which has appreciated more than 3% against the dollar since December 2. A stronger peso should give the central bank the confidence to continue easing monetary policy, which, in turn should provide a much-needed boost to the Mexican economy. Downside risks remain present, however, as the credit rating outlook for Pemex and Mexico’s sovereign debt outlook remains challenging.
Global Outlook
Japan Industrial Production • December 26
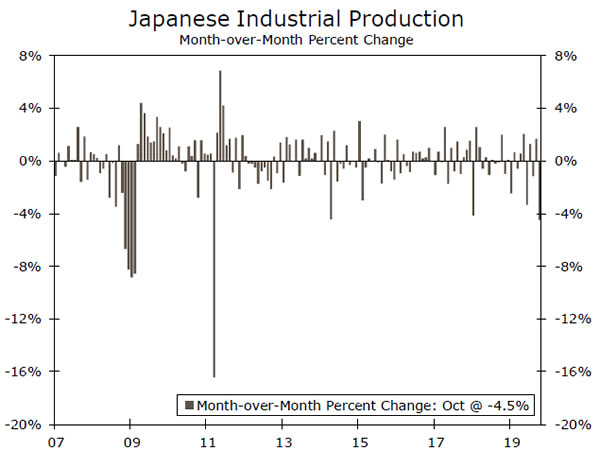
Industrial production plunged in Japan in October, falling 4.5% in the month, which was the largest monthly decline since the 2011 earthquake and tsunami. October’s print was also impacted by natural disasters, namely the typhoon that hit Japan that month. The increase in Japan’s value added tax rate on October 1 may also have temporarily dampened demand, and by extension output, for durable goods. Thus, we doubt the state of the Japanese factory sector is nearly as bad as the recent data would suggest.
In a statement released at the conclusion of this week, the Bank of Japan noted the slowdown in industrial production, but pointed to an “increasing trend” in business fixed investment and corporate profits at “high levels” as reasons not to be too concerned. Gross fixed capital formation rose 4.9% year-over-year in Q3-2019, which, given the ongoing global growth challenges and perennially weak economic growth in Japan, is a reasonably strong reading.
Previous: -4.5% Consensus: -1.1% (Month-over-Month)
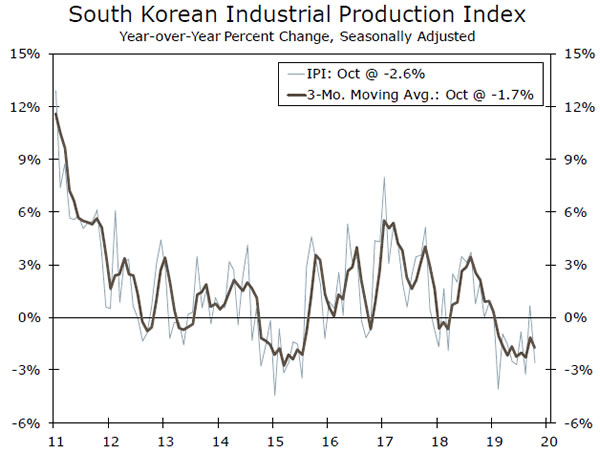
South Korea Industrial Production • Dec. 29
Industrial production growth in Korea has been on a steady downward slide since the end of 2018. Through October, industrial output fell 2.6% year-over-year. Interestingly, the magnitude of this industrial slowing quite closely mirrors the one that occurred in 2015 (left chart), when fears about a significant slowdown in the global economy generally and China specifically were swirling, as they have been for the past several months.
This week, we published an update to our June report on how China-dependent economies are performing. In the most recent report, we highlighted that there are signs of a near-term stabilization in these economies, which bodes well for the global outlook. Given that 13% of South Korean output can be attributed to foreign final demand in China (the fifth highest share in the world), a turnaround in industrial production over the next few months would be a telling sign that this stabilization is indeed occurring in China.
Previous: -1.7% Consensus: -0.7% (Month-over-Month)
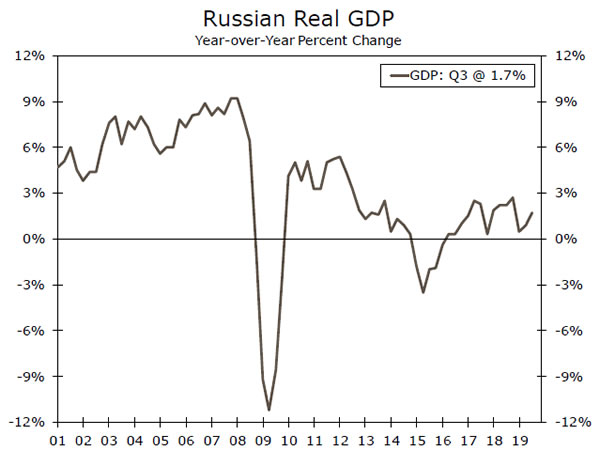
Russia Q3 GDP • December 30
On December 30 we will receive the second look at Q3 real GDP growth in Russia, as well as a detailed breakdown by expenditure. Real GDP growth in Russia had been on a slide through the first half of the year, and was beginning to flirt with a dip below zero, but a turnaround in Q3 appears to have stabilized things.
The sources of this turnaround will be important. Household consumption growth was actually a solid 2.8% year-over-year in Q2, with most of that quarter’s weakness coming from exports, government consumption and gross fixed capital formation. If export growth and/or investment growth strengthened alongside the household sector, this would be an encouraging sign that domestic demand is still healthy in Russia. The effects of easier monetary policy and a stronger currency are likely helping: the central bank has managed to cut its policy rate 150 bps this year, and yet the ruble has still managed to strengthen 7.5% year-over-year against the dollar.
Previous: 1.7% (Year-over-Year)
Point of View
Interest Rate Watch
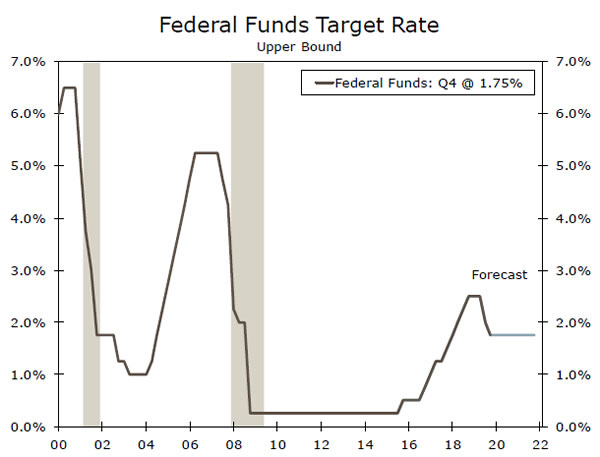
Change to FOMC Outlook
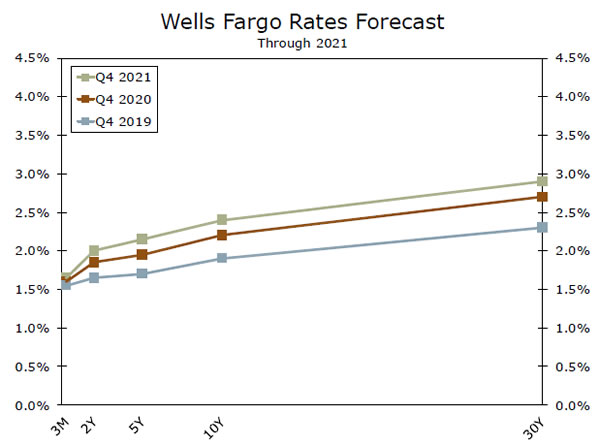
This week we needed to follow the old dictum, which is widely, if perhaps inaccurately, attributed to John Maynard Keynes that “when the facts change, we change our minds.” Specifically, we had been looking for the Federal Open Market Committee (FOMC) to cut its target range for the fed funds rate another 25 bps in early 2020. But as we described in more detail in a recent report, we now expect that the FOMC will keep its target range unchanged at 1.50% to 1.75% through the end of 2021 (top chart).
Our old forecast was predicated on our assumption that the 15% tariff on Chinese goods that was to take effect on December 15 would do so as scheduled. Because financial markets did not seem to be priced for another episode of tariff hikes, we surmised that stock markets would weaken and credit spreads would widen when the tariffs went into effect. In our view, the FOMC would want to offset this tightening in financial market conditions, at least in part, with another rate cut.
In the event, however, American and Chinese negotiators reached agreement on December 12 on the outlines of a phase one trade deal. Because financial conditions have not tightened, it does not seem likely now that the FOMC will ease policy further.
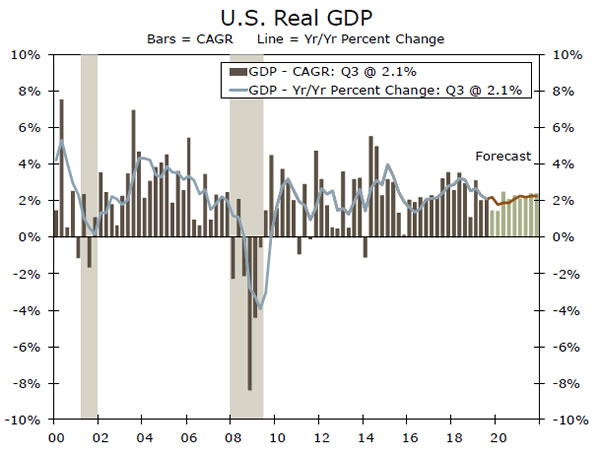
But if our forecast of real GDP growth of roughly 2% per annum throughout 2020 and 2021 proves to be reasonably accurate (middle chart), then the committee likely will not raise rates either, at least not anytime soon. In our view, U.S. economic growth would need to be significantly stronger and or inflation meaningfully higher than its present rate of roughly 2% for the FOMC to hike rates.
Although the Fed likely will be on hold, we forecast that long-term interest rates will drift slowly higher in coming quarters (bottom chart). As uncertainty about the economic outlook slowly begins to dissipate, investors should become a bit less risk averse. Moreover, the flood of Treasury issuance to finance $1 trillion fiscal deficits should put some upward pressure on longterm interest rates.
Credit Market Insights
Do Banks or Firms Remain Cautious?
The yield curve has steeped considerably since its inversion this summer, as fears of an imminent recession have subsided. Commercial banks, however, may remain cautious. Q3 marked the highest net percentage of banks tightening standards for commercial and industrial (C&I) loans since 2016, according to the latest Senior Loan Officer Opinion Survey. In terms of commercial banks aggregate holdings, the year-over-year percentage change of C&I loans has been declining since March.
While this may suggest a more cautious approach to lending among banks, demand also seems to be weakening, as a net 20% of banks reported weaker demand for business loans in the third quarter. Uncertainty among businesses was certainly a factor in the third quarter, and weaker demand for credit is unsurprising when you consider that business fixed investment grew at its weakest pace in nearly four years.
As bank’s extension of business credit has subsided, commercial banks have increased their holdings of Treasury and agency securities over the past year at the fastest rate since 2011. This can similarly be viewed as a cautious maneuver by banks taking on safer assets, but could also simply be a product of weaker demand from businesses. While uncertainty has subsided, trade policy and slower global growth continue to weigh on businesses outlooks. As such, we think it is unlikely that we see a large revival in C&I lending in the near term—even despite 75 bps of easing by the FOMC this year.
Topic of the Week
Boeing Production Halt Is an About Face for Q1
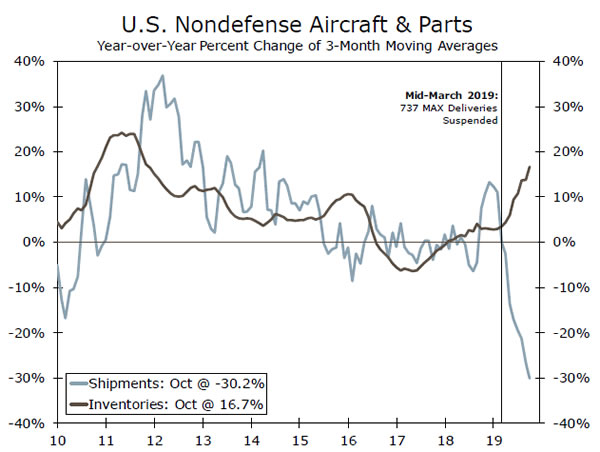
On Monday, Boeing announced that it will “temporarily suspend production on the 737 MAX program beginning next month.” In March, Boeing halted shipments of the jetliner after aviation agencies across the globe grounded it following two fatal crashes. With shipments halted, Boeing cut production to 42 737 MAX aircraft per month, bringing the total produced and currently sitting at production facilities or unused airfields to approximately 400 aircraft.
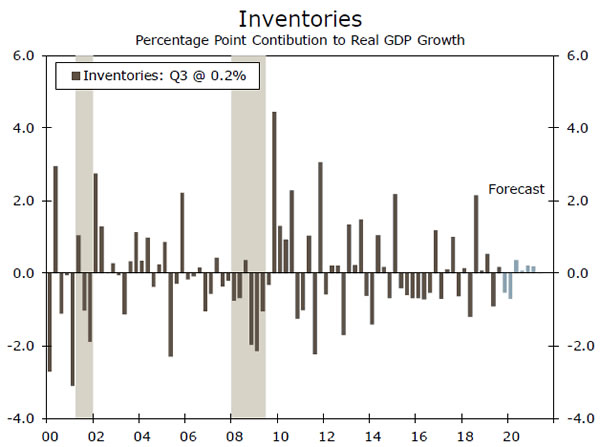
Since the aircraft were being produced but not shipped, in terms of GDP accounting, the grounding was expected to produce a drag on equipment spending and net exports, which would be roughly offset by an accumulation in inventories. As seen in the top chart, this has largely been realized with the drop off in aircraft & parts shipments and build in inventories since March. Our working assumption was that Boeing would continue to produce the jetliner at its stated rate and, once the plane received the all clear to fly, Boeing would resume shipments by gradually unwinding its built-up inventory.
But, with the production rate now falling to zero at the start of next year, we have removed the 126 737 MAX jets that would have been produced in Q1 from our forecast.
Aircraft and related parts account for only 2.8% of industrial production (IP), but, by our estimates, the 737 MAX currently accounts for roughly 60% of Boeing’s production. Cutting this production to zero, therefore, manifests itself in a sizeable way in Q1 IP. The production cut is enough to bring IP into negative territory in Q1 and reduce the expected build in inventories. By our calculations, if the 737 MAX production cut lasts through the first quarter, it would reduce Q1 headline GDP growth as much as 0.5 percentage points (bottom chart).
This drag is set to reverse, however, once production and shipping resume, though the exact timing of that remains uncertain. Our current expectation is that the jet is cleared sometime in Q1 with production and shipments resuming in the following quarter. This, of course, remains subject to change, and with any new developments, we will update our forecast accordingly.


