
U.S. Highlights
- Equity markets are poised for their second week of gains, buoyed by the White House’s guidelines for re-opening the economy. The price of oil touched an 18-year low, driven by the historic drop in demand.
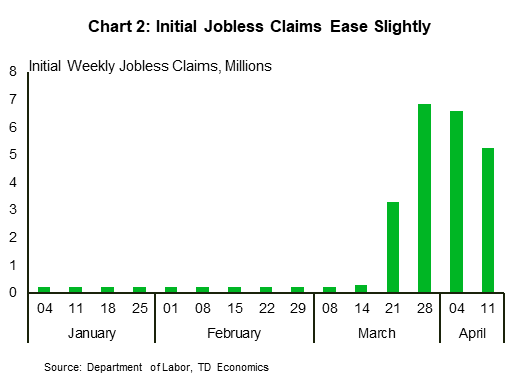
- March economic indicators showed a dramatic drop in activity, even though shutdowns only got underway mid-month. Jobless claims also continued to mount in the second week of April.
- Some European countries are starting to relax restrictions in select sectors, while the UK and France have extended their closures. The White House’s guidelines ultimately leave decision authority with individual governors.
Canadian Highlights
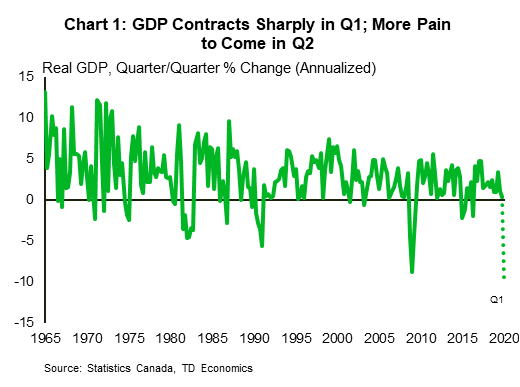
- Preliminary monthly GDP data released by Statistics Canada showed output contracting by an unprecedented 9% m/m in March. This implies that real GDP contracted by around 10% (annualized) in Q1, with the worst yet to come in Q2.
- Housing market also saw significant slowdown in activity in March as home sales declined by 14.3% (m/m). Listings also fell, helping to keep prices steady on the month, but risks to home prices are skewed to the downside.
- Policy makers continued to adjust and expand policies aimed to support households and businesses through this unprecedented shock. Several government programs were expanded this week, while the Bank of Canada ramped up its asset purchase program.
U.S. – Closures Hit March Economic Data Hard
As the COVID-19 pandemic continues, equity markets are poised for their second week of gains, buoyed by the White House’s guidelines for re-opening the economy. Even so, the price of oil touched an 18-year low, driven by the historic drop in demand. Oil is not the only thing Americans are consuming less of, with the March economic indicators released this week setting new milestones for declines.
The dramatic nature of the shutdowns necessary to contain the pandemic came into sharp focus in March indicators (Chart 1). Core inflation had its first monthly decline in ten years. Retail sales fell a record 8.7% on the month. Housing starts plummeted by the largest amount since 1984, and industrial production had its biggest drop since 1946. On top of this hard data, the NY and Philly Fed’s manufacturing sentiment indices plunged in April.
Weekly jobless claims also continued to mount. In the week ended April 11th, 5.25 million Americans filed for unemployment benefits. This is the second week of decline, suggesting the peak of the claims wave may be behind us (Chart 2). Even so, these job losses look set to take the unemployment rate to between 15-20% in April, a post-war high. We expect that the incredibly popular Paycheck Protection Program, rolled out though part of the CARES Act will start to reduce the number of layoffs, now that small businesses can access this short-term funding. Unfortunately, the program has already run out of funds, and Congress has not yet negotiated a deal to increase funding.
The dramatic impact of necessary shutdowns in China lead real GDP to decline 6.8% in the first quarter versus a year ago. This is China’s worst single quarter since it started publishing comparable data in 1992, and the first contraction since 1976 (end of the Cultural Revolution). On the upside, activity in March was better than the first two months of the year as activity gradually re-opened.
Some European countries are relaxing shutdown measures, while others are extending lockdowns. Spain and Germany have joined Austria, the Czech Republic and Norway on the list of countries that have started to relax measures in select sectors. Meanwhile, France and the U.K. have extended lockdowns into May. In the United States, Donald Trump released his guidelines for “Opening Up America Again”, which affirms that implementation is at individual Governors’ discretion. States could start a three phase re-opening process once they have a downward trajectory of cases over a 14-day period, its hospitals are able to handle the caseload without “crisis” measures, and it has put in place robust testing of health care workers. It suggests activities be resumed in gradual phases, with many activities being opened but with physical distancing limitations. Restaurants, for example, can only open if they can operate under strict social distancing protocols.
With authority on re-opening various activities resting with Governors, states are coordinating their approaches within regional groupings. Collaborations have formed in the West, Midwest, and Northeast and given divergent infection patterns across the country, re-opening is likely to look quite different across the country.

Canada – Policy Responses Scale Up Amid Record Drop In Economic Activity
This was another eventful week, filled with record-setting economic data and policy actions by the Federal Government and the Bank of Canada. The TSX moved sideways, weighed on by a record-smashing GDP decline in March and concerns that the worst is yet to come. Oil also traded lower as the short-term boost from last week’s OPEC+ agreement to cut production fizzled out. The WTI benchmark price plummeted to below $18/barrel at one point on Friday. As we note in a recent report, supply-side adjustments may not help prices much in the near term, given the amount of demand destruction, but it will speed up the recovery once demand starts improving.
That recovery, however, is still months away, and incoming economic data continues to paint a dire picture of unprecedented contraction in economic activity. Preliminary monthly GDP data released by Statistics Canada this week showed output contracting by an unprecedented 9% m/m in March, implying that real GDP contracted by around 10% (annualized) over the first quarter as a whole (See Chart 1). As shocking as this figure is, we are in for far worse as the impact of ‘full’ social distancing shows up in the coming months. The Bank of Canada estimates that the level of GDP in the second quarter could be between 15% and 30% lower than where it ended last year, implying an annualized contraction in Q2 of between 40% and 70%.
Housing markets also saw a significant slowdown in activity in March as home sales declined by 14.3% (m/m) (Chart 2). Sales would have been worse if not for robust activity at the start of the month. Equally important is the fact that listings also fell, helping to keep prices steady on the month and suggesting that financial stresses have not compelled households to sell their homes. In this regard, homeowners are no doubt benefitting from mortgage deferral programs. However, the longer economic weakness lingers, the greater the chance that some households will have to list their properties.
Realizing the unprecedented size of this economic shock, the government continues to adjust and expand policies aimed at supporting households and businesses. This week, the Canada Emergency Response Benefit was expanded to include part-time and seasonal workers, as well as people who’s EI has run out. The Emergency Business Account Program was also expanded, with eligibility criteria widened. The government is also working on a new program, called Canada Emergency Commercial Rent Assistance, to provide rent relief to small businesses for the months of April, May and June.
The Bank of Canada also ramped up its policy supports this week. As expected, the Bank held the overnight rate unchanged at the “effective lower bound,” but expanded its asset purchase program. The Bank’s purchases of Provincial bills will be joined by purchases of up to $50 billion of Provincial bonds, and up to $10 billion of investment grade corporate bonds. This may not be the Bank’s last intervention either. The Bank’s messaging made it clear that the economy is facing an intense shock, and while much has been done, it clearly intends to do all it can to not only soften the blow, but to speed up the post-containment recovery.

Canada: Upcoming Key Economic Releases
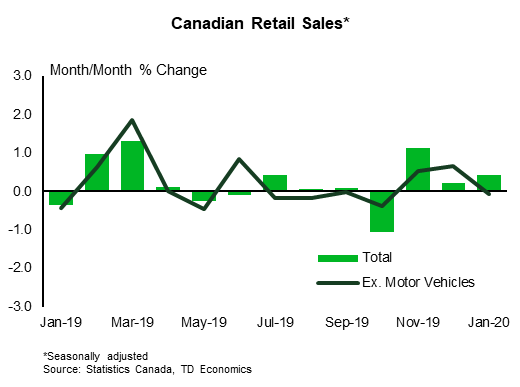
Canadian Retail Sales – February
Release Date: April 21, 2020
Previous: 0.4%, ex-auto: -0.1%
Forecast: 0.5%, ex-auto: 0.3%
Consensus: NA
Retail sales are forecast to rise by 0.5% in February ahead of what should prove to be a precipitous drop in March. Auto sales should make a positive contribution to the headline print, leaving ex-auto sales up 0.3%. The latter provides a solid rebound from January’s 0.1% decline, helped by a healthy labour market and strong consumer confidence. Real retail sales should come in slightly above the headline print on lower consumer goods prices although the sharp drop in preliminary auto sales and hours worked point to a historic pullback next month.
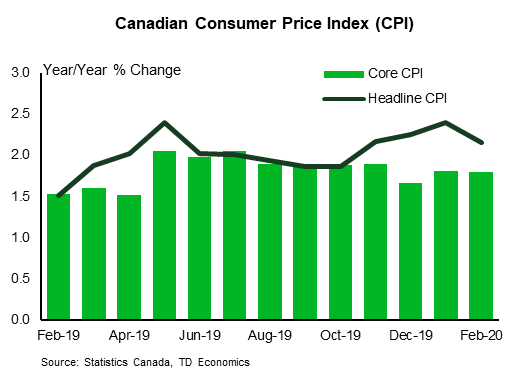
Canadian CPI Inflation – March
Release Date: April 22, 2020
Previous: 0.4% m/m, 2.2% y/y, Index; 137.4
TD Forecast: -0.4% m/m, 1.1% y/y, Index: 136.9
Consensus: NA
TD looks for inflation to decelerate sharply in March with headline CPI slipping to 1.1% y/y (down 1.1pp from February). This reflects a 0.4% decline on the month, although this will translate into a more significant drop on a seasonally adjusted basis. March tends to see the largest tailwind from seasonal factors, including gasoline and personal apparel, but these seasonals will be dwarfed by the impact of COVID and social distancing. Gasoline prices fell 33% through the month and were down 18% on average, which will contribute to a sharp pullback in the year-ago contribution from energy (along with lower electricity prices). Elsewhere, we expect a positive contribution from higher grocery prices, reflecting a combination of stockpiling and FX passthrough, even if these are partially offset by lower restaurant prices.
Looking to core CPI, exclusion-based measures should materially outperform owing to gasoline and other energy products being stripped-out. This should leave CPI ex. food and energy just 0.2pp lower on a year-ago basis, with the BoC’s core measures decelerating by a similar magnitude. Stepping back further, this report will show only a partial adjustment to the post COVID environment. We expect a similar deceleration in April before CPI bottoms out near 0% y/y in May. The path from there is more uncertain and hinges upon the duration of the shutdown and strength of the recovery, but even in a scenario where restrictions are rolled back in May we expect inflation to remain below 1% through Q3.


