
The Reserve Bank Board meets next week on May 5.
Last week we forecast that the RBA would hold the cash rate steady at 0.25% out to at least December 2023.
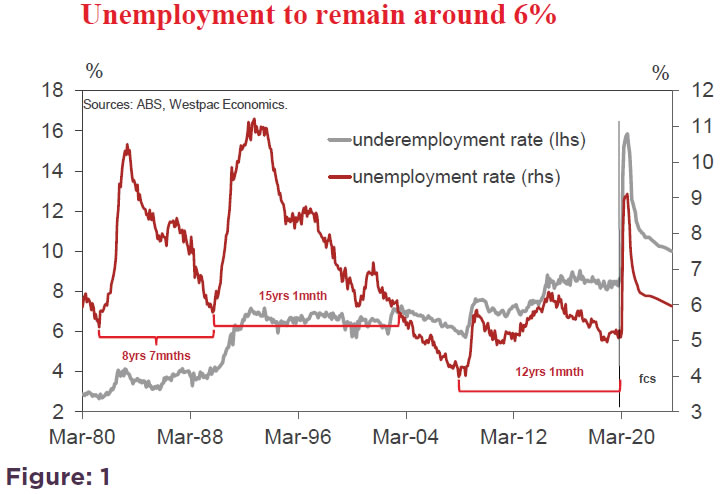
We argued that the unemployment rate and other measures of spare capacity in the labour market, such as the underemployment rate, would hold well above those levels which the RBA would assess as being consistent with their objectives (full employment of 4.5%) over that period.
Recall that the unemployment rate entered the Covid Crisis period at around 5% and is likely to reach 9% by June.
In the last two recessions in the early 1980’s and the early 1990’s it took nearly 9 years and 12 years respectively for the unemployment rate to return to the prerecession levels. Even in the GFC, which is not technically labelled a recession, the unemployment rate entered the period at around 4% and over the subsequent 12 years got slightly below 5% at its low point – unable to reach its pre-GFC low (Figure 1).
With the Governor indicating that marked progress toward full employment (4.5%) would need to be achieved before the cash rate would be increased our timeline of “not before December 2023” seems quite realistic.
We also noted that central banks no longer see the need to be as “pre-emptive” as they were in previous cycles with ample evidence that inflation is slow moving precluding the risk that the central bank will find itself well “behind the curve”.
The RBA has its dual objectives of full employment and its 2-3% inflation target. Of course the objectives are interdependent with persistent spare capacity in the labour market very likely to weigh on wages growth and therefore inflation. This is the scenario we envisage for the next few years.
However we did note that we expect the RBA will change its 0.25% target for the three year bond rate sometime in 2022. Holding the three year bond rate at 0.25% when the cash rate target is also 0.25% indicated that the RBA and the markets expect the cash rate to hold at 0.25% for the next three years. By 2022, that three year expectation will be unsustainable. However the RBA will still want to anchor that important short term rate and is likely to target a higher rate, say 0.40%, for the three year bond. Swap rates and forward rates would adjust to factor in some movement in the cash rate target over the subsequent three year period but, by anchoring the 3 year bond rate, the RBA will be able to limit market expectations for the expected tightening cycle.
Anchoring that short term rate will be important given the likely shift to fixed rate mortgages from floating rate over the next few years as borrowers realise that the cash rate target will not be lowered any further.
On May 8 the RBA will release the Statement on Monetary Policy. Of most interest will be the Bank’s growth and unemployment rate forecasts. There will be extensive detail in these forecasts, although the key points have already been discussed by the Governor, namely: a 10% output contraction in 2020 H1; 6% contraction through 2020; 6-7% growth in 2021; peak unemployment rate of 10% in June; and negative through the year headline inflation to the June quarter 2020.
As we saw recently with the IMF, the Bank is likely to release a number of scenarios based around the profile of the Covid Crisis.
On March 31 Westpac released its growth forecasts, based on an assessment of production and employment across industries of: minus 9.5% in H1; minus 5% through 2020; and 4% growth in 2021. We expected the unemployment rate to reach 9% by June; 7.4% by December and remain above 6% for the next few years.
Our only significant difference with the RBA’s forecasts are around the high 6-7% growth rate expected in 2021. The RBA’s reasoning behind that view will be of considerable interest.
In a recent speech the Governor praised the Australian economy from the perspective of balance sheets including the Australian government and the central bank.
Arguably we can assess the “quality” of a government’s balance sheet from the perspective of its net debt levels while a central bank’s balance sheet can be assessed in terms of its sheer size (excluding its holdings of foreign reserves and some liabilities including notes and coins). Lower government debt allows scope to use fiscal policy to boost growth; restricts the impact on the deficit of funding costs; and generally implies that the government has not been “crowding out” the private sector from borrowing.
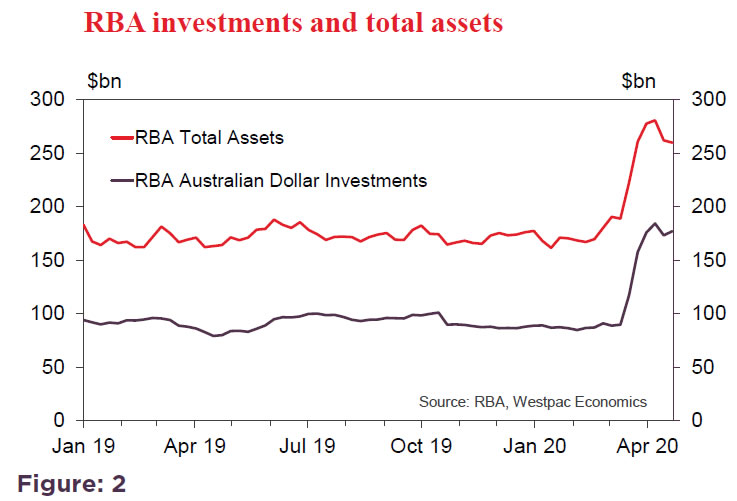
A stable central bank balance sheet indicates that the financial system is operating efficiently precluding the need for the central bank to intervene in the operations of the financial system. A dominant central bank in the financial system runs the risk of distortive price signals and excessive liquidity (through high levels of banks’ excess reserves) which, when economies have moved back towards operating at potential, could promote damaging asset bubbles. Unexpected increases in central bank balance sheets usually indicate increased activity by the central bank in the financial system. Consider Figure 2, showing the recent lift in the size of the RBA’s balance sheet which has been almost exclusively explained by an increase in holdings of financial securities.
In this regard it is interesting to look forward and track the impact that the Covid Crisis has had and is likely to have on the government and central bank balance sheets of Australia and the US.
Readers will be aware that on March 31 Westpac forecast that the Australian bond supply would have to lift by an additional $310bn over the course of 2020 and 2021 to finance the bulging Federal budget deficit associated with an increase in the cyclical deficit ($120bn) and the cost of the government’s stimulus policies (around $190bn – about 10% of GDP).
The stimulus policies include the $130 billion which has been the forecast cost of the JobKeeper Payment, budgeted for 6 million workers (around 46% of the workforce). Reports to date are that businesses employing 3.3 million workers have applied for the Payments. With businesses needing to qualify by justifying a reduction in revenue, relative to a year ago, of 30% (turnover less than $1 billion) or 50% (above $1 billion) it is reasonable to expect that the $130 billion might be a significant overestimate. Five million workers are covered by mining; agriculture; construction; finance; government and professional services while 1.7 million work in health and 1.1 million in education.
It is unlikely that a very high proportion of employers in these industries, including major banks that are specifically excluded, will qualify for the payments. There may also be specific issues for major listed companies using JobKeeper, given the implication of a 50% fall in annual revenue.
So, arguably, the Government may be overestimating the cost of Job Keeper. Certainly it is reasonable to expect that there may be capacity to extend the Payments beyond September for those industries that remain under pressure.
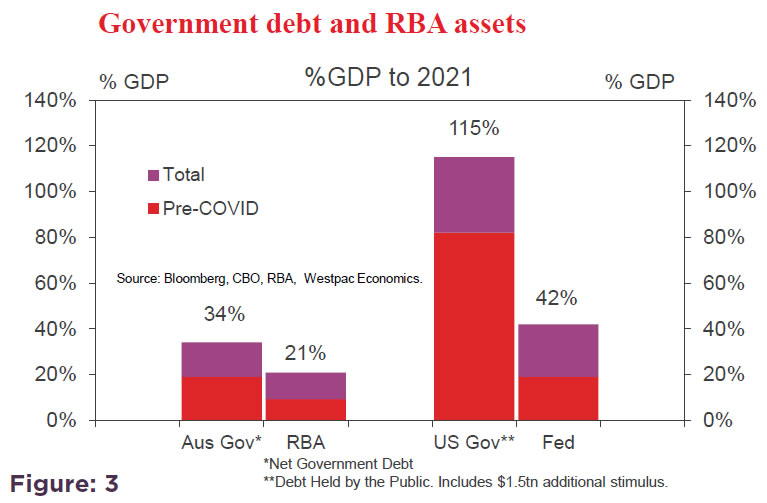
Based on the current assessed numbers we estimate that the Australian government’s net debt will rise from 19% of GDP at June 2019 to 34% at June 2021, (Figure 3).
However, compare that situation with the US. The US government has already announced stimulus of around USD2.5 trillion and, unlike Australia, considerably more is expected – our estimates point to around another USD1.5 trillion. Combined, that would be 20% of US GDP, compared to 10% in Australia. Based on the Congressional Budget Office estimates of current policy costs and the likely cyclical deficit and adding the $1.5 trillion in additional stimulus we expect net US government debt will increase from around 80% of GDP to 115% of GDP; a staggering 35% increase.
The RBA is going to boost its balance sheet significantly beyond the recent increase of $70bn. It has committed at least $90bn in three year fixed rate funding to the banking system (only around $3bn of which has been reported to have been drawn down).
We expect the RBA will extend its QE policy into 2022 and play an important role in supporting the government’s massive increase in bond issuance through its secondary market activities.
As we discussed, we expect the government to issue an additional $310bn in bonds while the RBA is committed to targeting the three year rate and stabilising the overall curve. That could imply a further $150bn of purchases to complement the current purchases of around $50bn (including semi government securities).
The bank funding and securities purchases would lift the RBA’s balance sheet by around $250bn (or 12.5% of GDP) over that period. Compare that with the US Federal Reserve which will eventually expand its balance sheet from around $4tn to up to $9tn, including around $1.5tn in short and long-term repos; $1.6tn in Treasuries and mortgage backed securities (both already transacted); $750bn in corporate bonds and syndicated loans; $600bn in small business loans; and $500bn in local government loans (last three still to come).
Note also that the FED was unable to sustainably taper its balance sheet following the original build up from USD1tn to $4tn in the aftermath of the GFC.
That expansion of the FED’s balance sheet would represent an increase in the balance sheet from 20% of GDP to around 45% of GDP over the Covid period. The contrast in the forecasts for the two sets of balance sheets – government and central bank-out to 2021 – is set out in Figure 3.
Some conclusions are appropriate. Firstly, the scale of the likely damage to the official balance sheets in Australia is quite remarkable – a 15% of GDP lift in net debt for the government; and an increase of around 15% of GDP in the size of the RBA’s balance sheet.
However, with 4.5% of that increase required to be paid back by the banks in three years and the bulk of the other assets being short term government bonds the RBA seems likely to be able to return its balance sheet to a more normal level over the next 3 to 5 years.
Australian Federal government debt has much less chance of normalising, given our “around trend” growth outlook for the Australian economy. In fact, that 34% of GDP figure may, over time, prove to be inconsistent with its AAA status (note that Standard & Poors has already put Australia on negative watch).
However, that concern should not be a source of urgency for the government. Its primary aim should be to reduce the degree of spare capacity in the labour market through growth oriented reforms and stimulatory policies, including personal tax cuts.
The outlook for the balance sheets in the US is not so encouraging. Government debt is forecast to lift from around 80% of GDP pre COVID to 115%, post COVID. The FED’s balance sheet is expected to increase by a stunning 25% of GDP to almost 45% of GDP. Furthermore the post GFC experience is not encouraging that the FED will be able to successfully reduce the size of its balance sheet.
Both countries are suffering extraordinary shocks to their official balance sheets. Australia starts from a much less leveraged position and has much brighter prospects of eventually reducing their balance sheets, particularly at the central bank.
From the perspective of markets this must be a very important positive signal for the medium term outlook for AUD/USD cross.


