
U.S. Review
May Retail Sales Surge, but Other Data Disappoint
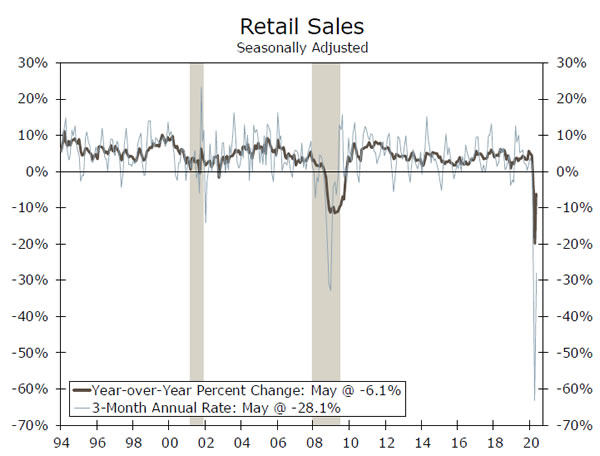
- Retail sales kicked off the week with a bang, rising 17.7% month-over-month in May. The increase was larger than every single one of the 74 forecast submissions.
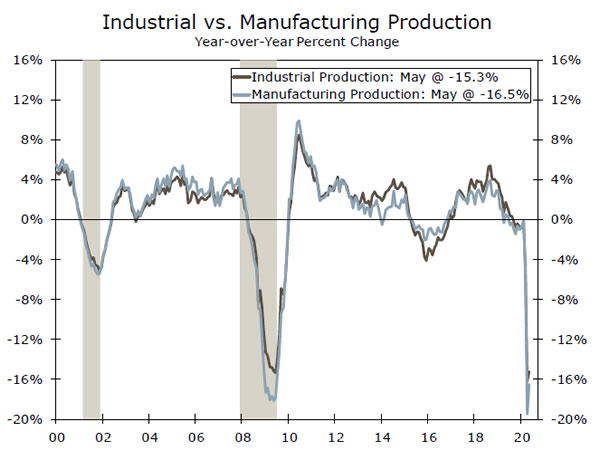
- The factory data were not as encouraging. Industrial production growth was just 1.4% in May, below the 3.0% consensus. On a year-over-year basis, the decline in industrial output was more than double the decline in retail sales.
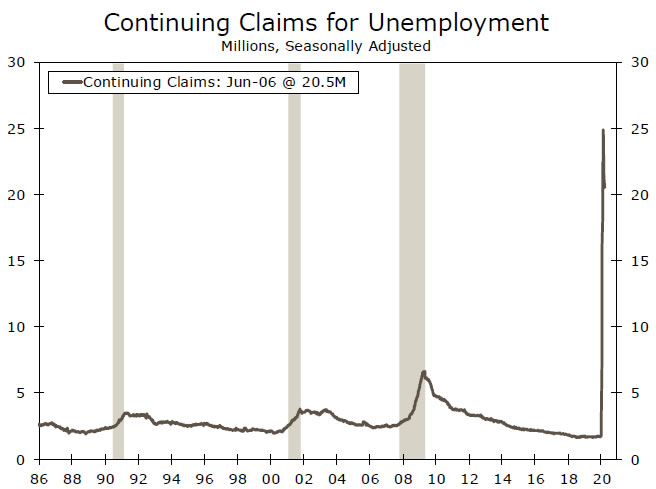
- The initial jobless claims data were the last major release of the week, and they too were disappointing. Even more disappointing were the continuing claims data, which showed almost no change in those receiving unemployment benefits from May 30 to June 6.
May Retail Sales Surge, but Other Data Disappoint
The U.S. economic data this week was decisively mixed. Retail sales kicked off the week with a bang, rising 17.7% month-overmonth in May. The increase was more than double the Bloomberg consensus and greater than every single one of the 74 forecast submissions. With May’s gain, retail sales are “only” down about 6% year-over-year, and just 8% compared to February’s levels (see chart on page 1).
The headline beat was clearly boosted by the ongoing re-opening in many states. Furniture store sales rose 90% month-over-month, and clothing store sales were up 188%. However, despite these eyepopping growth numbers, total sales were still clearly depressed; compared to a year-ago, sales were down 23.2% for furniture and 63.3% for clothing. On the other end of the spectrum, non-store retailers posted another huge gain, up 9.0% in the month and 25.3% year-over-year. After a 29.1% gain in May, eating and drinking places saw sales that were “only” down 38.7% compared to May 2019, somewhat remarkable given how much this sector is still closed/capacity limited in many places. At a high level, the retail sales data were a clear sign of pent up consumer demand and an excellent sign for economic growth in H2-2020.
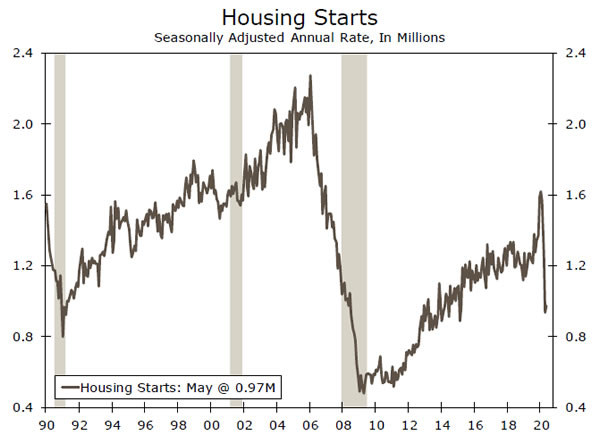
Unfortunately, the factory sector data were not as encouraging. Industrial production growth was just 1.4% in May, below the 3.0% Bloomberg consensus. On a year-over-year basis, the decline in industrial output was more than double the decline in retail sales (top chart). Re-opening at auto plants around the country led to a more-than-doubling of motor vehicle & parts production (+120.8%). Still, even after that increase in May, the level of output for autos is still less than a quarter of the way back to its peak. The relatively soft reading for industrial output compared to retail sales is interesting, as it bucks the trend seen in some other major economies. In China, for instance, industrial production was up 4.4% year-over-year in May, but retail sales were down 2.8% over the same period. The U.S. housing starts data for May were also weak, barely rising compared to April’s depressed level (middle chart)
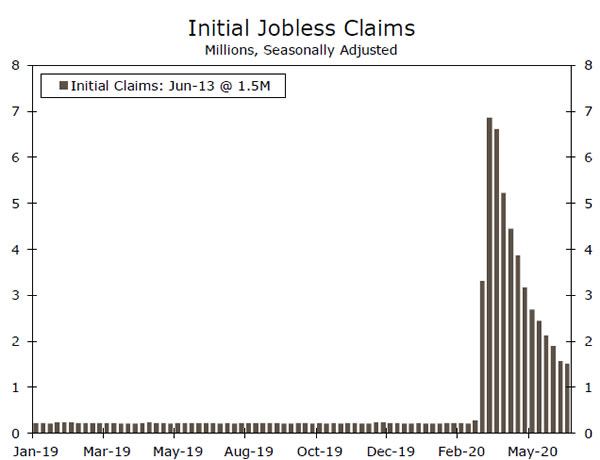
The initial jobless claims data were the last major release of the week, and they too were disappointing. Weekly first-time unemployment claims fell 58,000 to 1.508 million in the week ended June 13. Forecasters were expecting a larger decline to 1.29 million. Even more disappointing were the continuing claims data, which showed almost no change in those already receiving unemployment benefits from May 30 to June 6. At 20.5 million, the level of continuing claims remains extraordinarily high (bottom chart).
The jobless claims data did not serve as an accurate leading indicator for the May employment report. However, we would caution against completely disregarding the indicator due to just one data point. At the moment, the claims data point to a June jobs reading that could be weaker than May’s reading. There were roughly 22 million jobs lost in March and April, and 2.5 million added in May. So while a 1 million-2 million gain in June would certainly be welcome, employment would still leave a huge amount of ground to be made up.
U.S. Outlook
Home Sales • Monday & Tuesday
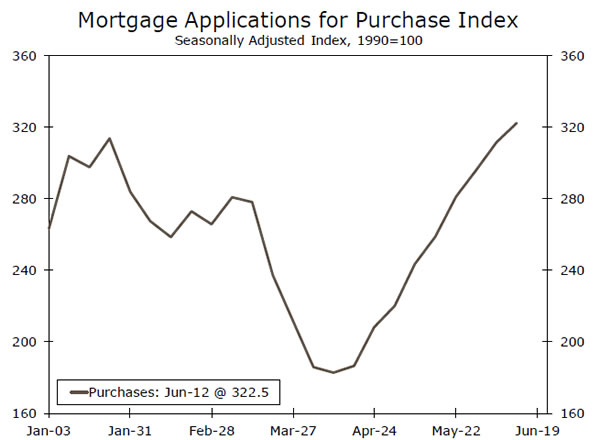
Housing demand has roared back from its coronavirus-related slump, with the mortgage purchase applications index now up 21% year-over-year. Coronavirus job losses have disproportionately affected renters, leaving many prospective homebuyers relatively unscathed for now. And with mortgage rates at record lows, many are finally taking the plunge into homeownership.
Existing home sales were much weaker in April than new home sales, likely due to differences in the prevalence of virtual tours. Overall, it appears realtors and homebuyers have been surprisingly nimble, adapting to an environment with less open houses and more virtual tours. It may take some time for the stronger demand to materialize in the sales data, but make no mistake that the demand is there, and rising. And with construction perhaps slower to increase—housing starts disappointed this week—we could see greater upward pressure on home prices.
Previous: 4.33M & 623K Wells Fargo: 3.98M & 612K Consensus: 4.15M & 630K (Existing & New)
Jobless Claims • Thursday
Weekly first-time unemployment claims fell 58,000 to 1.508 million in the week ended June 13. While talk of a second wave of COVID-19 has dominated headlines, the smaller-than-expected decline likely reflects some moderation in the pace of re-opening, with the easiest re-openings behind us. Indeed, initial jobless claims in excess of one million this far into the crisis is a troubling sign. While the number is still declining, on an absolute basis 1.5 million layoffs in a week is still remarkably high.
This week’s claims data covered the survey week for the June employment report. On a four-week basis, initial claims averaged 1.774 million, down from 3.044 million in mid-May. That is less than half the improvement from the April to May survey week. Jobless claims did not do a good job of anticipating May’s surprisingly large jump in nonfarm payrolls. Rehiring from temporary layoffs likely differs greatly from cyclical layoffs.
Previous: 1508K & 20.5M (Initial, Continuing respectively)
Personal Income & Spending • Friday
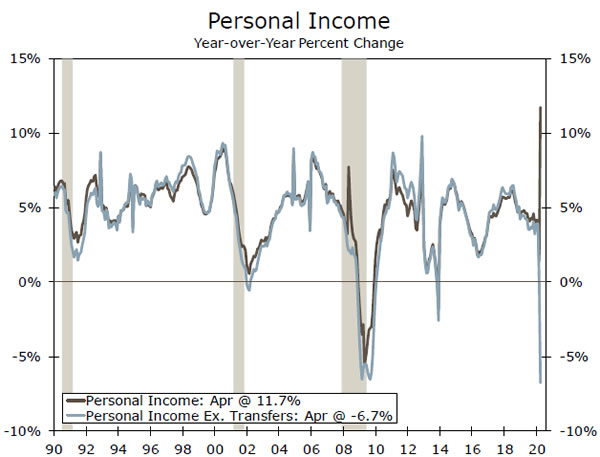
The April personal income and spending report blew out expectations, as incomes rose nearly 11% in a month when millions of people lost their jobs. In hindsight, this should not have been surprising. April was when the majority of American’s received their $1,200 economic impact checks. Moreover, those who had lost their jobs received an additional $600 per week in unemployment benefits, with many making more than when they were working. Excluding transfer payments, income fell nearly 7%. The divergence between the two series can effectively be thought of as the effect of fiscal policy. In that context, the CARES Act was very effective, at least in April, at maintaining aggregate income flowing to the economy. There won’t be another round of $1,200 checks in May, which will likely cause incomes to fall.
Spending plunged roughly 14% April, but should rebound strongly in May, based on a similar pattern seen in retail sales.
Previous: 10.5% & -13.6% Wells Fargo: -8.8% & 9.7% Consensus: -5.9% & 8.7% (Income & Spending)
Global Review
Global Central Banks Back in Focus This Week
- It was a busy week for central banks across the globe, with some opting to ease monetary policy further.
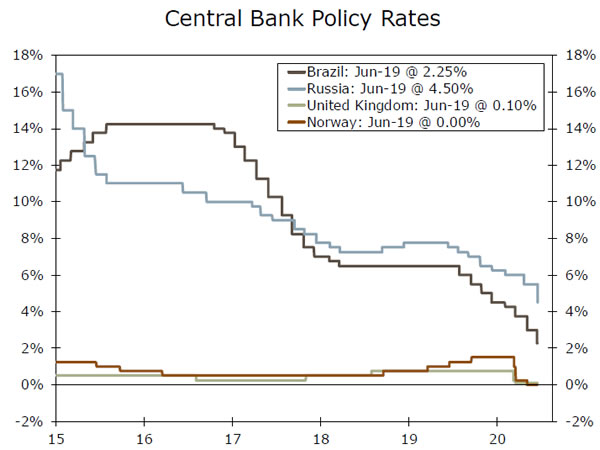
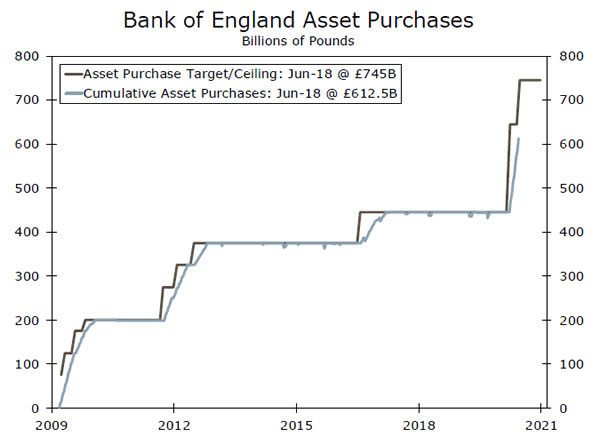
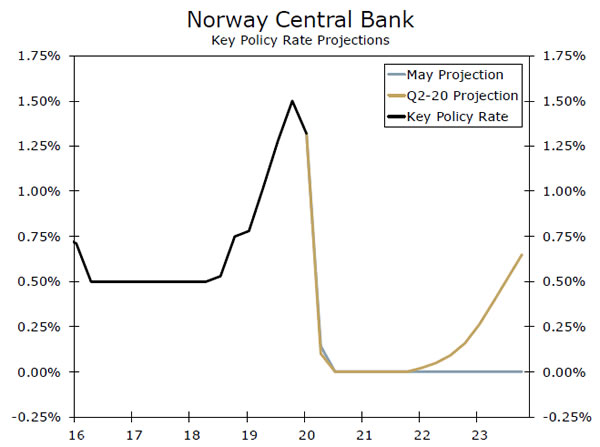
- Within the G10, the Bank of England announced a £100B increase in its asset purchase target, but some elements of the accompanying statement were less dovish in tone. Meanwhile, the Norges Bank left its policy rate unchanged at zero.
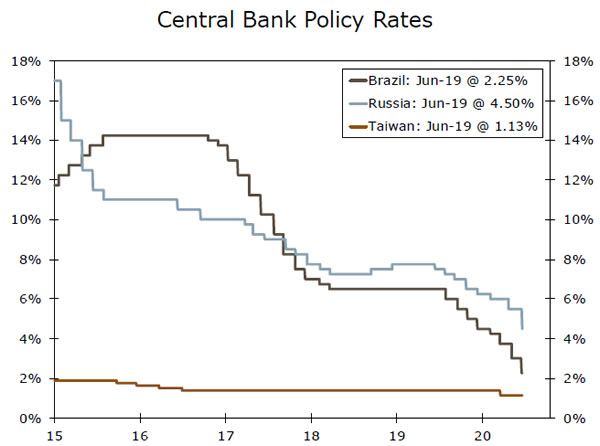
- Among the emerging economies, Brazil’s central bank delivered a 75 bps rate cut, and left the door open to additional cuts. Meanwhile, the Bank of Russia cut its Key rate a full percentage point, but Taiwan’s central bank kept rates on hold.
Global Central Banks Back in Focus This Week
Central banks remained in the spotlight this week, with some central banks opting to ease policy further. Most notably, the Bank of England (BoE) announced a further £100B increase in its asset purchase target to £745B—a bit less than our expectation for a £200B increase. However, some elements of the accompanying statement were less dovish in tone, with one policymaker dissenting in favor of no increase in asset purchases. In addition, the central bank said its asset purchases would be completed around the end of the year. In the case that the BoE stays within its new £745B cap, that would imply a £5B weekly pace of asset purchases over the rest of 2020, a significant slowdown in the pace of purchases from the current rate of roughly £14B per week. Following the announcement, the pound initially rallied; however, it soon pared its gains and the U.K. currency and other U.K. financial markets sank. Given the adverse market reaction and still soft economic outlook, we think the risk remains for a further increase in the asset purchase target, and still look for the pound to be a laggard among its G10 peers.
Sticking with the G10, the Norges Bank kept its policy rate unchanged at a record low of zero, but the overall tone of the announcement was less dovish. Although the Norwegian economy is still likely to contract for the full-year 2020, the central bank now expects a smaller contraction than previously anticipated, with mainland GDP projected to fall 3.5% in 2020, but rebound 3.7% in 2021. We also look for a milder recession this year, which should help support the krone over the medium- to longer-term. In the accompanying statement, policymakers noted economic activity has started to rebound at a stronger pace than previously expected, suggesting the worst is likely over for Norway. In addition, the rise in oil prices and the re-opening of the economy should help stimulate growth. The overall outlook suggests the benchmark rate is likely to remain at zero for some time, but policymakers indicated that rate hikes could start further out, with rates reaching 0.65% by the end of 2023.
Many emerging central banks also met this week including Russia, Brazil and Taiwan. The Bank of Russia notably cut its key rate 100 bps to 4.5%—the lowest since 2014—and left the door open to additional rate cuts in the coming months. Meanwhile, in its eighth consecutive cut, Brazil’s central bank reduced its Selic rate 75 bps to a record low of 2.25%. The Brazilian economy has come under significant pressure with activity continuing to worsen, and inflation expectations falling notably. In the accompanying statement, the committee noted that the size of the stimulus measures seem to be comparable with the virus’ economic effect and foresees any possible future rate changes to be residual, keeping the door open to further policy easing.
Finally, Taiwan’s central bank surprised markets by holding its benchmark interest rate steady at a record low of 1.125%, as most economists were looking for a 12.5 bps rate cut to 1.00%. The central bank governor noted that its previous rate cut in March has been effective in helping achieve its goal to reduce the financial burdens caused by the COVID-19 pandemic, and expects the worst is over for the Taiwan economy.
Global Outlook
RBNZ Policy Decision • Tuesday
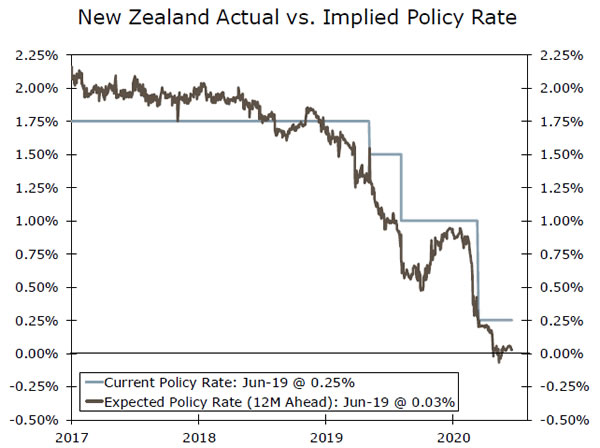
At the May 12 monetary policy meeting, the Reserve Bank of New Zealand (RBNZ) unleashed large stimulus measures aimed at cushioning the economy against the negative effects of COVID-19. The committee agreed to substantially expand its Large Scale Asset Purchase program to NZ$60B (~19% of GDP) from the previous limit of NZ$33B (~10% of GDP). Since the May policy meeting, the outlook for the NZ economy has improved. The NZ government removed all of its remaining lockdown restrictions and social distancing requirements, except for strict border control measures after the nation reported it eliminated COVID-19. Although NZ is likely to still fall into a deep recession, we expect the re-opening of its economy will help limit longer-term economic damage. Against that backdrop, we expect the RBNZ to hold the Official Cash rate at 0.25% at the upcoming meeting, and do not foresee the central bank moving rates in either direction for some time.
Previous: 0.25% Wells Fargo: 0.25% Consensus: 0.25%
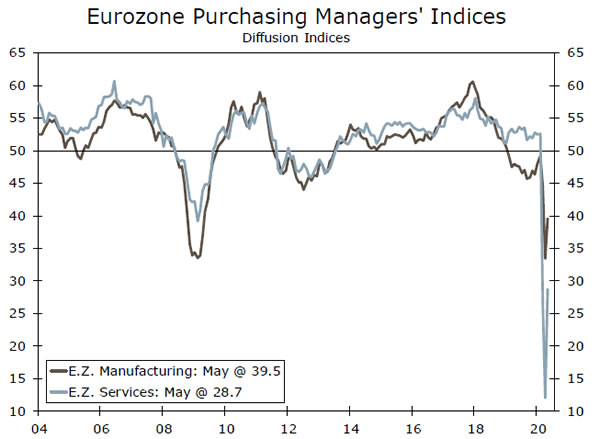
Eurozone PMIs • Tuesday
Next week’s preliminary release of the Eurozone manufacturing and service sector PMIs could offer some insight into the extent in which the economy is holding up going into the second half of the year. COVID-19 case and fatality growth appears to have slowed across most parts of Europe, and many European countries have begun to ease containment measures, allowing some businesses to re-open.
We will be focused on the June service sector PMI—which is expected to rise to 40.5 from 30.5 in May—for any signs of an acceleration in the pace of the rebound. Although the index is likely to rise, another below 50 reading is consistent with a sharp fall in overall GDP growth for Q2-2020. Meanwhile, the manufacturing PMI is expected to rise to 43.5 in June, perhaps a reflection of easier lockdown measures. Next week, we will also get Germany’s IFO surveys which should provide some additional insight to the extent of the Eurozone recovery.
Previous: 39.4 & 30.5 Consensus: 43.8 & 40.5 (Manufacturing & Services)
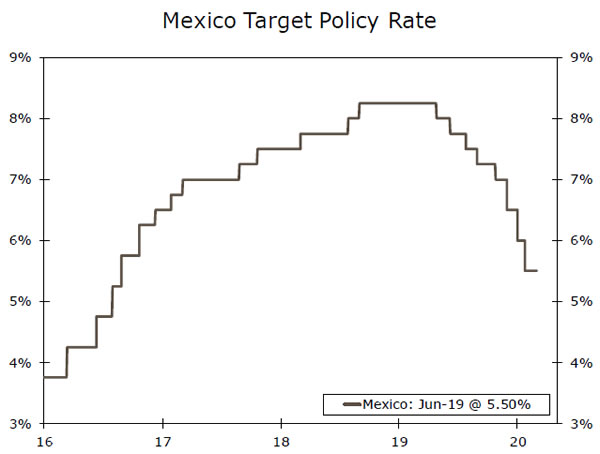
Banxico Policy Decision • Thursday
COVID-19 placed significant pressure on the Mexican economy in H1-2020, as lockdown and social distancing measures, as well as decreased demand for Mexican exports weighed on the economy. Although the Mexican economy is likely to contract sharply this year, the AMLO administration has pushed back on implementing fiscal resources to offset the slowdown, limiting the government’s fiscal response to the pandemic. As a result, the central bank has led the response by significantly easing monetary policy.
So far this year, the Central Bank of Mexico cut its overnight rate 175 bps, to 5.50%. We believe the central bank will need to continue to lower interest rates as economic growth continues to slow and inflation remains below its long-run average. Moreover, we look for another 100 bps of rate cuts over the next three months, bringing the policy rate to 4.50%.
Previous: 5.50% Wells Fargo: 5.00% Consensus: 5.00%
Point of View
Interest Rate Watch
Inflation Expectations and Fed Policy
Federal Reserve Chairman Powell delivered his semi-annual testimony to Congress this week, but he did not really say anything different from what Fed policymakers have been stressing recently. Namely, FOMC members “are committed to using our full range of tools to support the economy in this challenging time.”
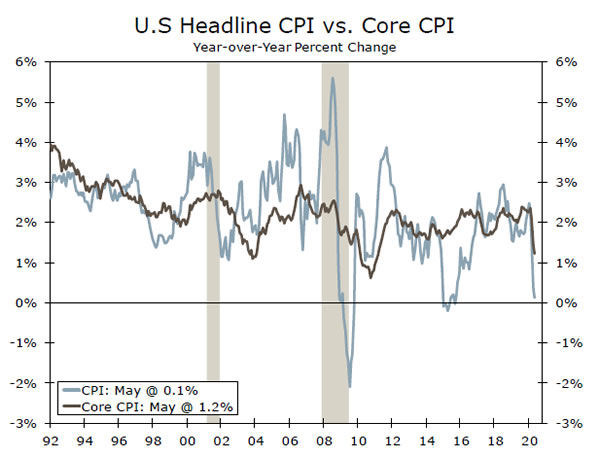
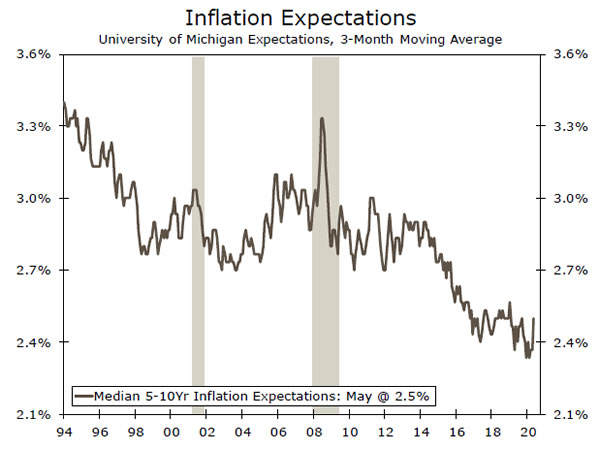
Vice Chair Clarida also made a speech this week that included references to inflation and inflation expectations. Clarida noted that the core rate of CPI inflation fell to only 1.2% in May, the lowest rate in nine years (top chart), and he expressed concern that inflation expectations could fall to uncomfortably low levels. Inflation expectations are important because there tends to be a strong association with inflation expectations and realized rates of inflation. That is, if people expect prices to rise, they generally do. Conversely, if people expect prices to fall they generally do. So if people expect most prices to fall in the future, a self-fulfilling bout of deflation could potentially set in.
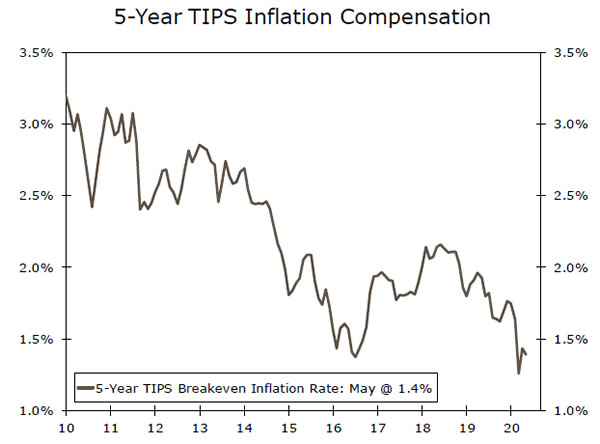
Inflation expectations, as measured by differences in yields on Treasury securities, have trended down to only 1.4% at present (middle chart). That is, investors expect that inflation will be only 1.4% five years from now. Survey-based measures of inflation expectations are a bit higher, but they too have drifted down to decades lows (bottom chart). Fed officials are rightly concerned about a potential vicious circle of deflationary pressure taking hold.
The implications of these concerns are straightforward: the Fed will continue to provide policy accommodation for a prolonged period of time. In other words, the FOMC likely will keep its target range for the fed funds rate between 0.00% and 0.25% through at least the end of next year. It will also continue its quantitative easing purchases of Treasury and mortgagebacked securities for the foreseeable future, which should limit any rise in long-term interest rates that is caused by gaping federal budget deficits. In that regard, we look for the yield on the 10-year Treasury security to drift up to only 1.15% by year end from roughly 0.72% at present.
Credit Market Insights
Fed Removes Hurdle for Bond Buying
On Monday, the Fed updated the terms for its Secondary Market Corporate Credit Facility (SMCFF) to indicate that it will begin purchasing “eligible broad market index bonds.” Before this announcement, the Fed’s purchases had been limited to bond ETFs and individual issuers, who met the requirements for the program. The new model essentially allows the Fed to create its own index that tracks broader bond market. Most notably, this change removes the hurdle for individual companies, who previously had to go through issuer certification before the Fed could buy their debt.
At a higher level, this move seems closer to an adjustment to the Fed’s bond buying program rather than a new initiative in itself. Either way, the step reiterated that the Fed is serious in its commitment to financial stability and markets took the news with a risk-on attitude. The investment-grade (IG) CDS index, which tracks the cost to protect against corporate debt defaults, dropped nine points on Monday, giving up nearly all of the prior week’s increase.
In its announcement, the Fed also reiterated that it will continue to aim for September 30, 2020 as a completion date for its bond buying program. While the Fed has left little doubt that it is willing to use the full size of its corporate credit facilities, thus far the announcement of its intentions have been sufficient to smooth market functioning.
Topic of the Week
Potential Regional Effects of a Second Wave
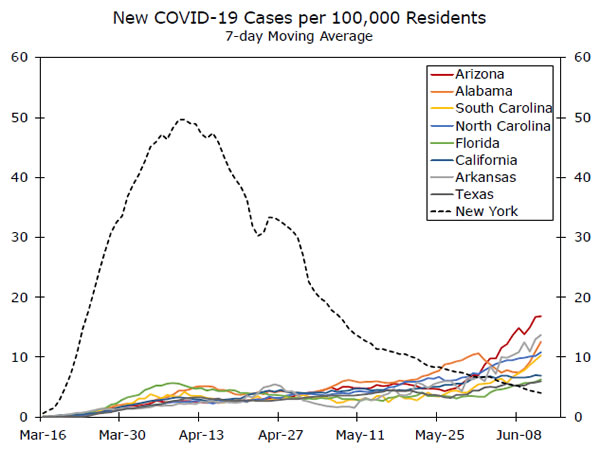
A wave of new coronavirus outbreaks appear to be spreading throughout the country following the easing of lockdown orders in early May. As of the second week in June, new coronavirus cases are trending higher in 20 states, several of which are seeing record highs.
While the rise in new cases can be partially explained by factors such as more prevalent testing and reporting lags, some state and local officials have cautioned that further deterioration could strain hospital capacity and necessitate a delay in re-opening plans or even a reimposition of restrictions on business activity. While likely necessary from a public-health perspective, slowing down or rolling back re-opening plans would curtail economic activity and potentially set back the recovery.
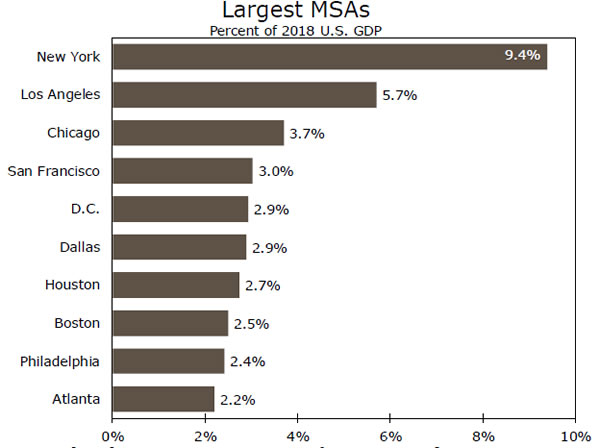
One concern is that the coronavirus appears to spread most easily in dense urban areas, which account for a disproportionate share of economic growth. The 10 largest metros account for roughly 37.5% of total U.S. output, and an even larger share of the growth. Sitting at the top of the list, the New York-Newark-Jersey City MSA, where the coronavirus now appears contained and re-opening efforts are underway, comprises almost 10% of national GDP. Second on the list is Los Angeles-Long Beach-Anaheim, which comprises 5.7% of total output and has reportedly seen a recent uptick in case growth.
The pandemic also appears to be intensifying in large Sun Belt metros, which prior to the coronavirus crisis had been among the fastest growing in the country. Houston, which is the fifth-largest metro in terms of population and sixth largest in employment, has seen an increase in case growth, and officials are considering re-issuing stayat- home orders. Florida is also seeing a surge in cases and the city of Miami recently announced that it would not be moving into the next phase of re-opening. Some bars and restaurants in the north and central part of the state have also voluntarily closed after some workers and patrons tested positive. This illustrates that, even without new lockdown orders, new waves of the coronavirus could weigh on consumer and business confidence and prolong the return of economic activity prior peak levels.


