The price of crude oil spiked yesterday as traders reacted to falling US inventories. According to the Energy Information Administration (EIA), oil inventories declined by more than 7 million barrels. That was a bigger decline than the 3 million that analysts were expecting. On Tuesday, data from the American Petroleum Institute (API) showed that inventories dropped by more than 8 million barrels. Other data showed that the US imported more than 1.2 million barrels of oil per day in the previous week. Meanwhile, gasoline inventories rose by about 419k barrels.
The British pound was little changed against the US dollar ahead of the Bank of England interest rate decision. Analysts expect that the bank will leave the interest rate unchanged at 0.10% and maintain the ceiling of quantitative easing at £725 billion. Still, most analysts will be watching the statement by the BOE for any hints of negative interest rates. In a recent note, analysts at Goldman Sachs predicted that the BOE will slash interest rates to zero in the September meeting. At the same time, some analysts have warned that negative rates in the UK would affect the large financial sector in the country.
The US dollar rose slightly during the Asian session as traders waited for the initial jobless claims data. Analysts polled by Reuters expect that more than 1.41 million people filed for jobless claims in the previous week. That will be less than the 1.43 million that applied for the claims in the week before. The claims numbers come at a time when Democrats and Republicans are continuing their deliberations on the enhanced unemployment benefits. The data will come a day after we received an impressive non-manufacturing PMI number from the US. The PMI rose from the previous 57.1 to 58.1. Further data showed that US exports rose to $158 billion in July while imports increased to $208 billion.
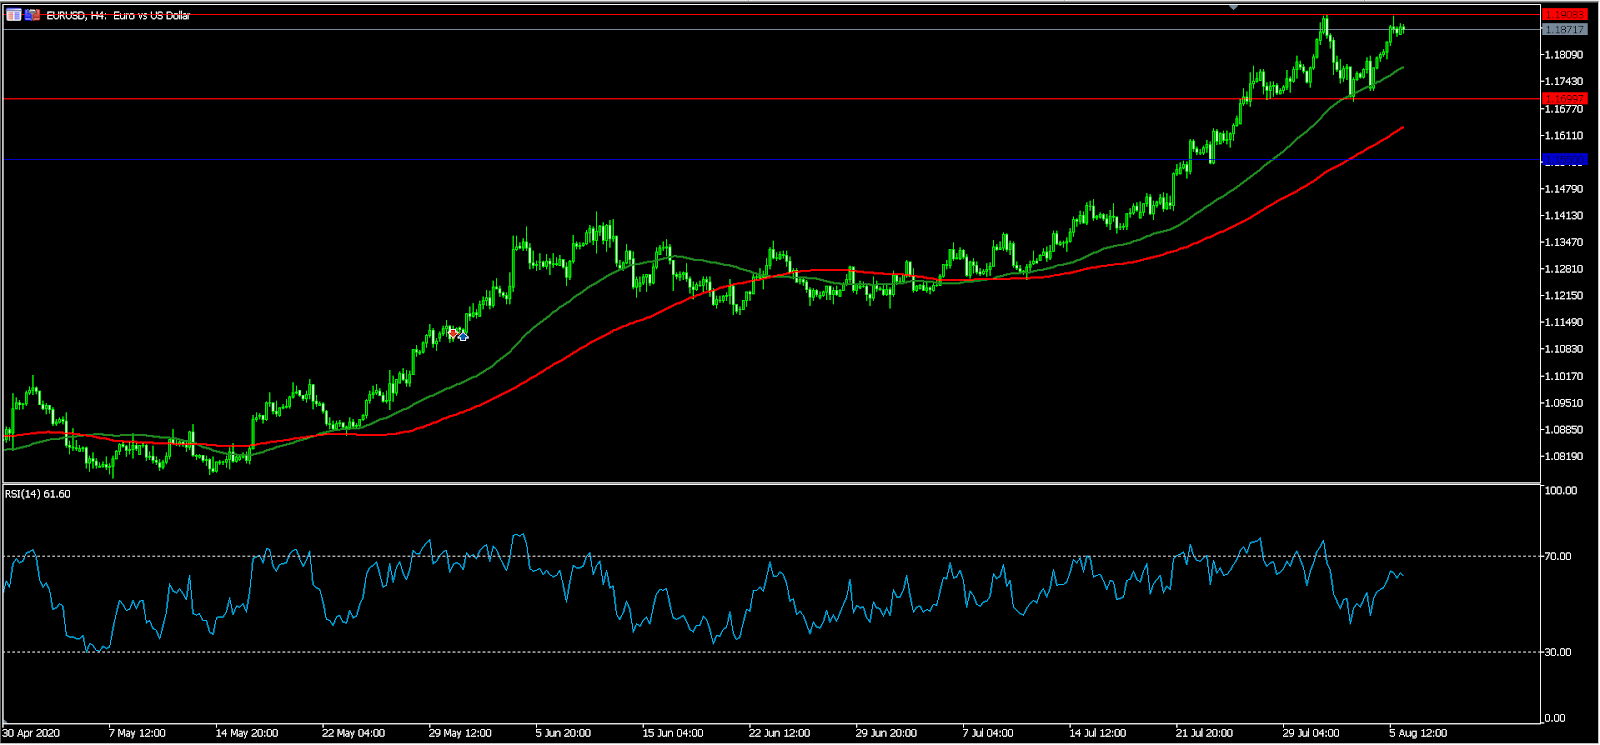
EUR/USD
The EUR/USD pair was little changed in the Asian session. The pair is trading at 1.1875, which is slightly below last month’s high of 1.1904. On the four-hour chart, the pair is still above the 50-day and 100-day exponential moving averages. Also, the RSI has moved to 62 from yesterday’s low of 42.16. Therefore, the outlook for the pair remains bullish but bulls will need to defend moves above 1.1900. A move above this level will see bulls target the next resistance at 1.2000.
GBP/USD
The four-hour GBP/USD pair has a close resemblance to the EUR/GBP pair above. As you can see, the price is a few pips below last month’s high of 1.3171. On the four-hour chart, the price is above the 50-day and 100-day exponential moving averages. Also, the RSI is at the neutral level of 62. Therefore, like the EUR/USD, the outlook for this pair is bullish if the bulls can push above 1.3171.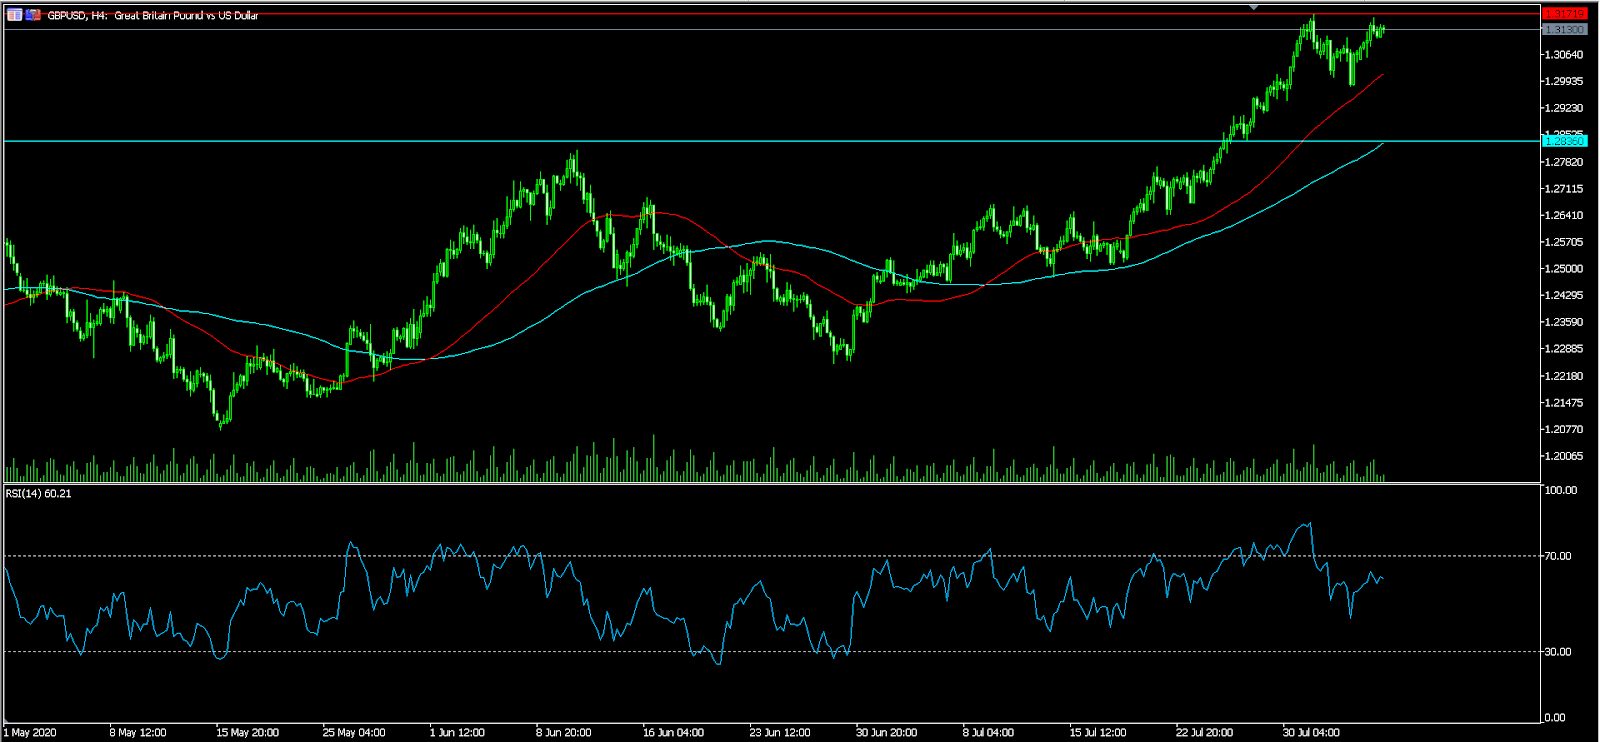
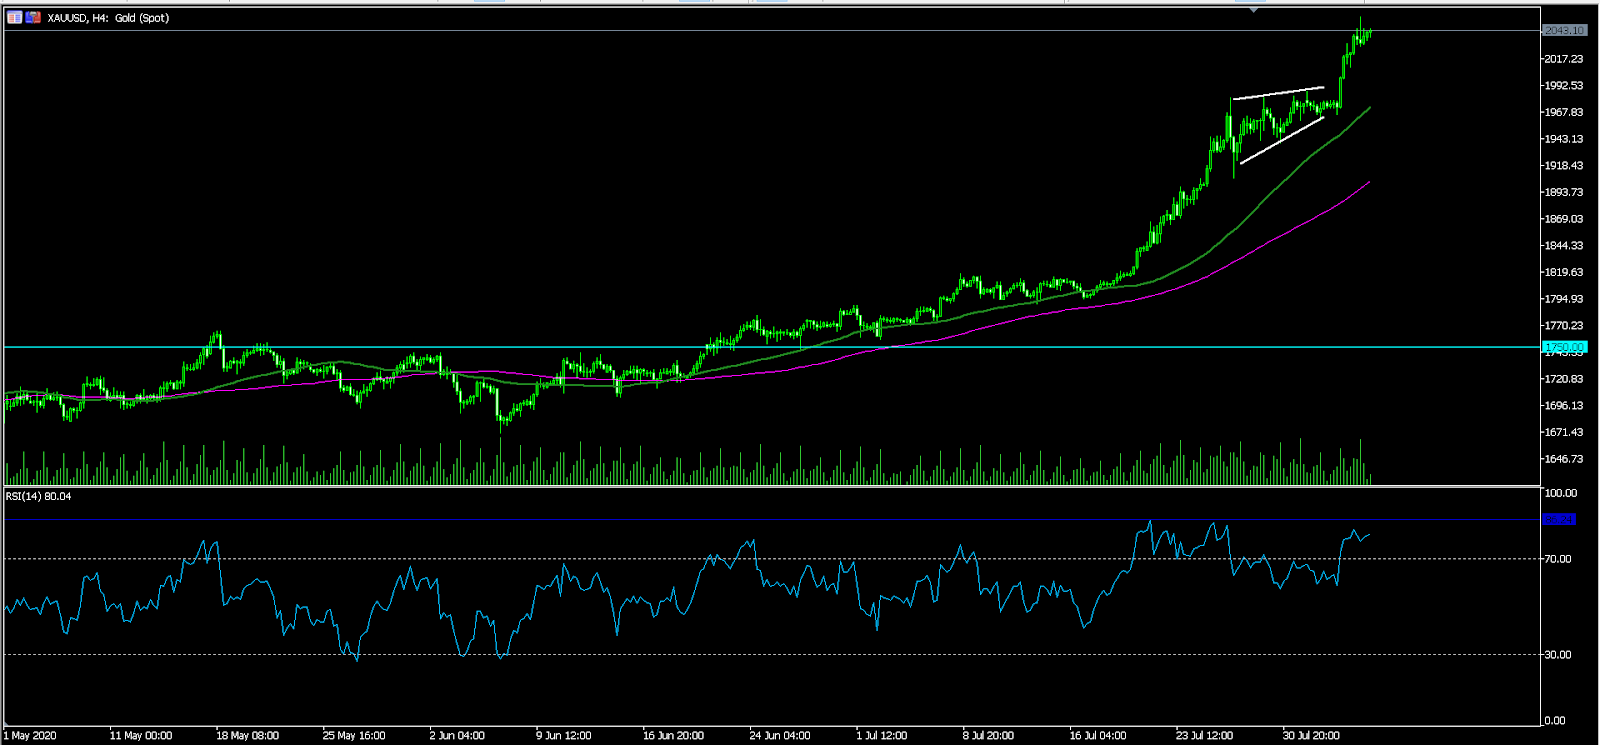
XAU/USD
The XAU/USD pair was little changed during the Asian session. On the four-hour chart, the price is slightly below the all-time high of 2054. The price is also slightly below the 50-day and 100-day exponential moving averages while the RSI has moved to the overbought level. The price remains above the 50-day and 100-day EMAs, which means that the overall trend is bullish.