
Summary
United States: Some Relief on Inflation, but It’s Still Hot Out There
- The CPI data this week showed that the sharpest monthly consumer price hikes may be behind us, but inflation is not about to quietly fade away. Ongoing supply constraints for products and labor, rising costs and renewed risks around COVID weighed on small business optimism in July and our own outlook for growth, as we describe in our latest Monthly Outlook.
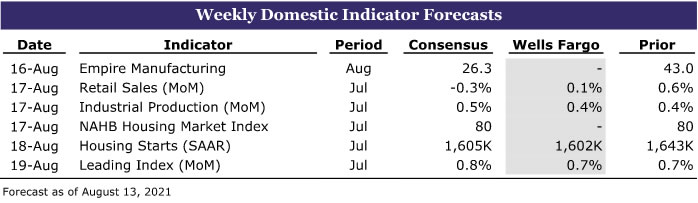
- Next week: Retail Sales (Tuesday), Industrial Production (Tuesday), Housing Starts (Wednesday)
International: Solid Showing From the U.K. Economy
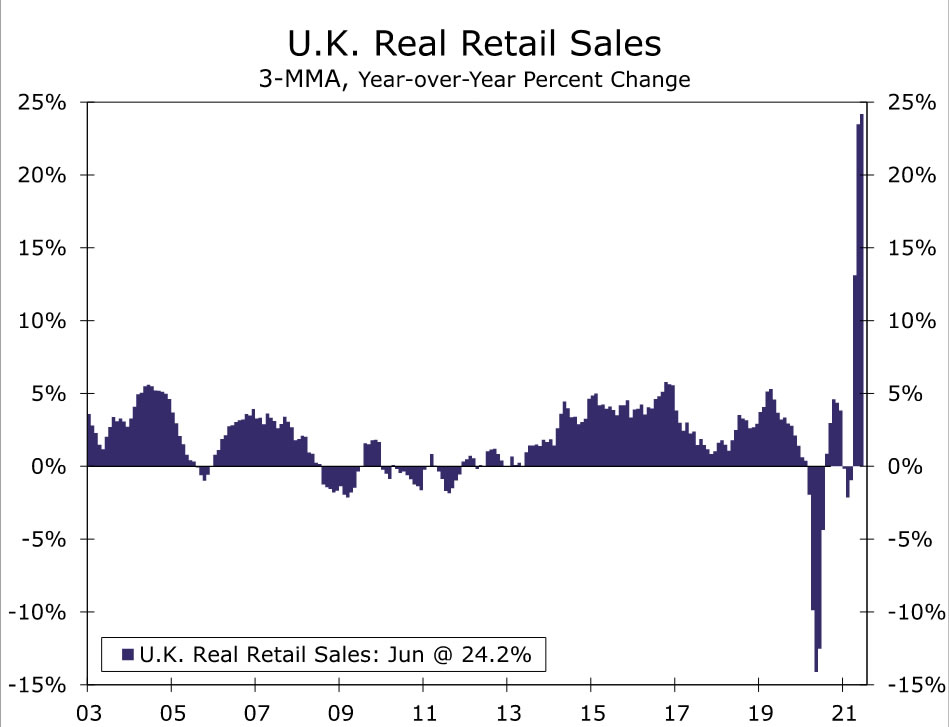
- The U.K. economy rebounded in Q2 from an early 2021 stumble, as GDP jumped 4.8% quarter-over-quarter, with strong gains in consumer spending and government spending. A sizable gain in June GDP also indicated the quarter ended on a firm note. While July retail sales are expected to rise only moderately, we still expect a decent-sized gain in U.K. GDP in Q3.
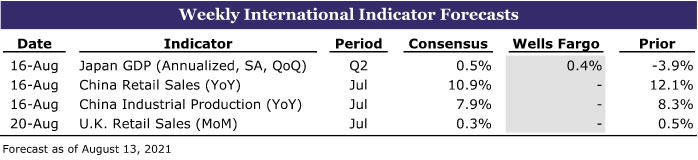
- Next week: Japan GDP (Monday), China Retail Sales & Industrial Output (Monday), U.K. Retail Sales (Friday)
Credit Market Insights: Credit Cards Along for the Spending Ride
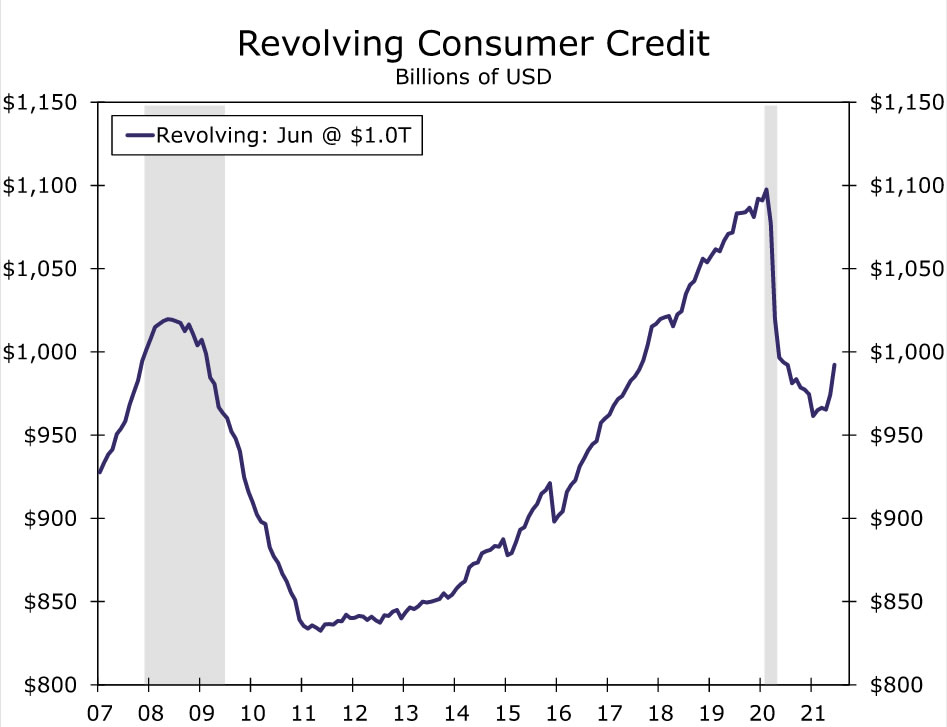
- Consumer credit outstanding grew by $37.7 billion during June, the largest increase on record according to data released by the Federal Reserve last week. While this is a significant jump, it is important to keep in mind that these increases are coming off of a relatively low base.
Topic of the Week: IMF Announces Significant New Allocation of SDRs
- The International Monetary Fund recently announced a significant new allocation of special drawing rights that is valued at $650 billion. Will the allocation have major consequence for the global economy?
U.S. Review
Some Relief on Inflation, but It’s Still Hot Out There
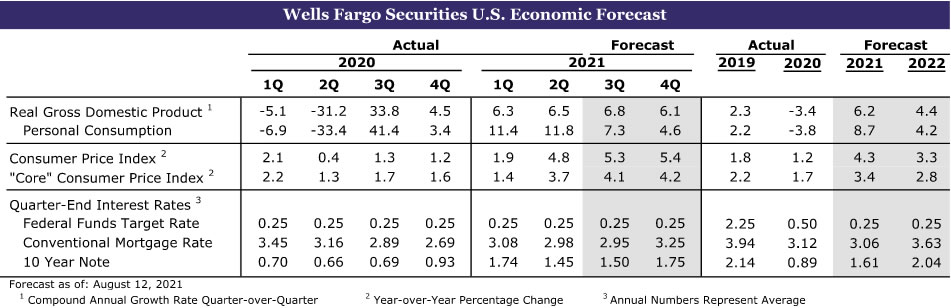
Fed officials likely breathed a sigh of relief when the July Consumer Price Index was released earlier this week. The 0.5% increase ended the four-month streak of upside surprises and showed price hikes easing from their startling pace over the past few months. Relief came on the used car front as well as in travel categories like car rentals and airfare, lending credence to the notion that the recent degree of inflation is unlikely to persist as supply constraints ease and demand cools from the frenzied pace of this spring’s reopening and stimulus spending.
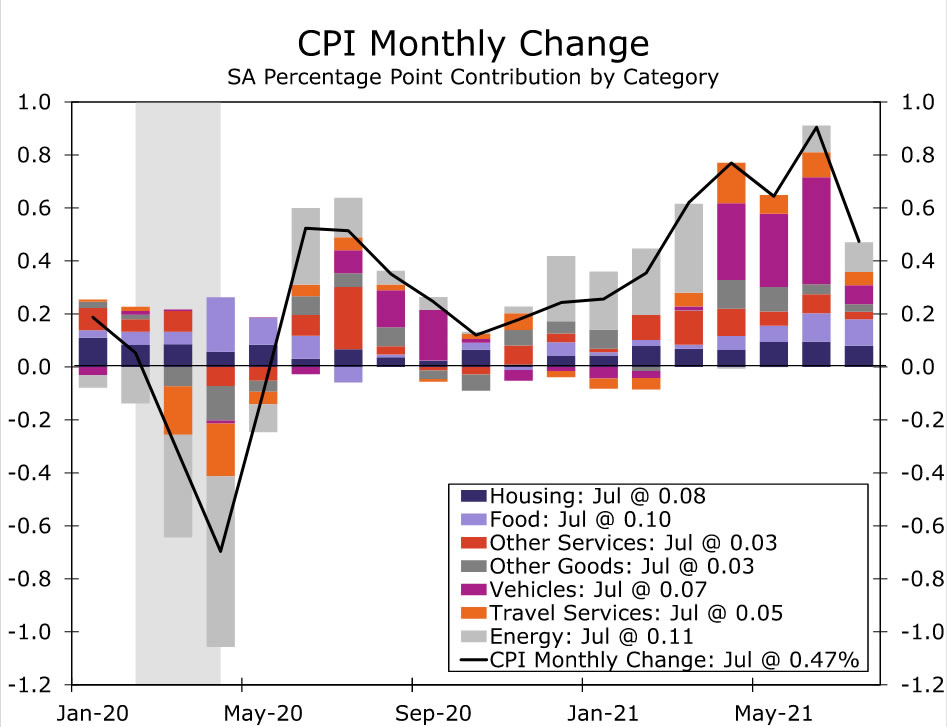
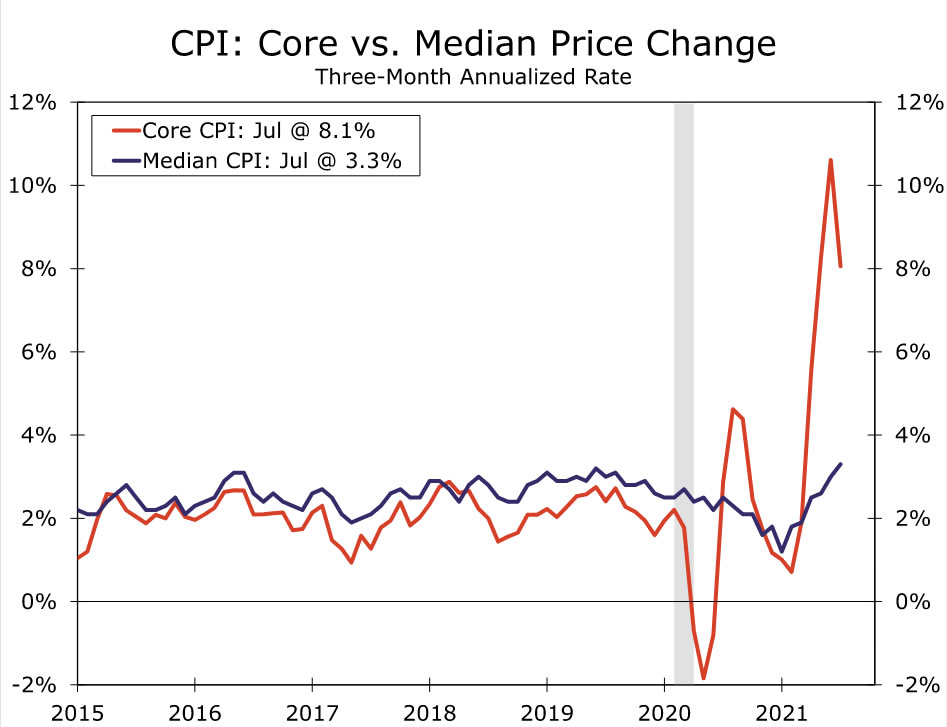
That said, inflation is not fading away entirely. While the direction of change was welcome, inflation continues to run at a strong pace. Even with used car prices leveling off, core inflation rose 0.3%. The Cleveland Fed’s Median CPI has advanced at a 3.3% pace the past three months—less extreme than the traditional core, which captures the outsized gains in a few small categories, but the fastest clip since 2008.
U.S. producers also reported strong price increases in July. The Producer Price Index for final demand rose 1.0% and is now up 7.8% from a year ago. Although there were some signs of easing further back in the pipeline, input costs continue to rise at an eye-catching pace for both goods and services, such as transportation. For example, services for intermediate demand are up 9.2% over the past year, nearly triple the high-water mark of last cycle, while processed goods prices are up 23% from a year ago.
Input costs pressures also extend to labor. The oddly tight labor market was on full display with job openings reaching a fresh record for June at 10.1 milllion. For every job opening, there was only 0.9 unemployed workers, a ratio similar to when the unemployment rate was at 4.0% in early 2018 versus 5.9% in June of this year. The rate at which workers are voluntarily leaving their job rose to 2.7%, well above prior cycle highs. This is a sign that workers have growing opportunities and are using this time to improve their job situation.
The pace of job switching has led firms to offer more flexibility, training and time off, but also pay. With a record 49% of small businesses reporting at least one job as hard to fill, the NFIB’s latest small business survey shows that plans to raise compensation remain elevated in July. But the ongoing struggles to find workers, secure product to sell and contend with rising costs seemed to take a toll on optimism in July. The survey’s headline index fell more than anticipated, with the largest drops in expectations for sales, earnings trends and the economy more broadly. The latest wave of COVID cases, the high inflation environment and ongoing supply constraints have similarly led us to pare down our expectations for growth over the coming months. As we discuss in more detail in our August Monthly Outlook, we now look for growth in the third quarter to increase “only” 6.8%.
U.S. Outlook
 Retail Sales • Tuesday
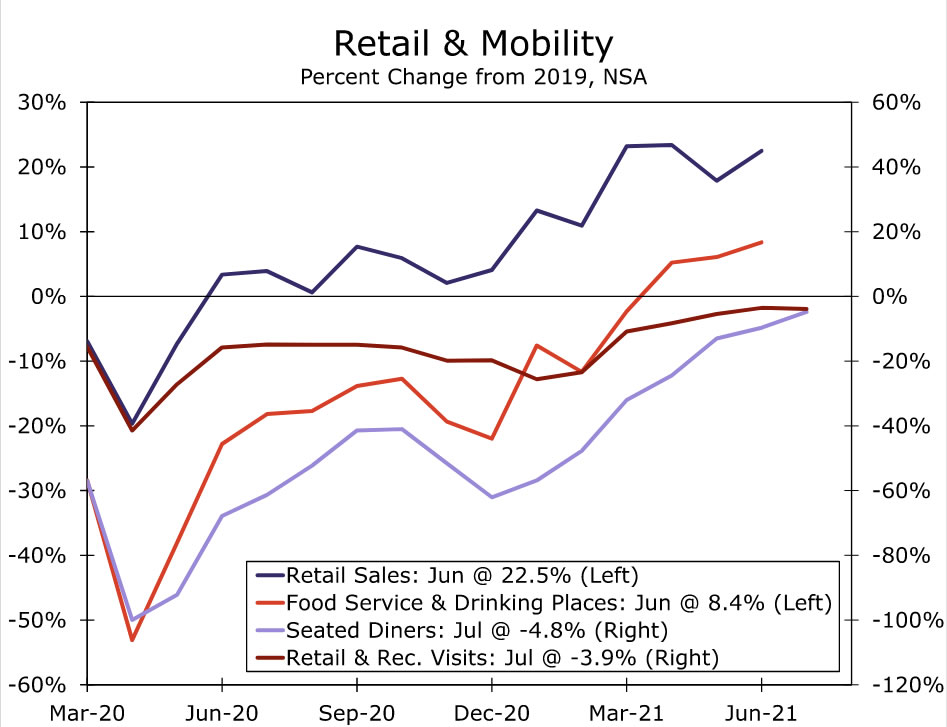
Retail sales were generally expected to slow this summer after their rapid recovery, as consumers shifted more spending toward services and experiences and away from goods. Data for June pushed back at this, as sales rose 0.6%, beating expectations for a 0.3% decline. Rather than a turn back toward stay-at-home habits, the details of the report showed that people were getting back out, with sales at clothing stores, gas stations, restaurants and bars all contributing to the top-line beat.
Looking ahead to July, we suspect sales growth slowed to around 0.1%. The spread of the Delta variant has tempered hopes for a further reopening of the economy. We did not see a reversal in visits to retail and recreation locations or seated diners at restaurants as we had seen in prior waves, but there was a stall in the return to normal in July. While retail sales have done well in the face of prior COVID waves, it seems unlikely that consumers will feel compelled to splurge on additional durable goods and appliances as they did last year. Durable goods by definition are meant to last, so the second appliance or recreational good may not be as helpful as the first. In addition, the run-up in goods prices over the past few months could lead to some sticker shock, making people more hesitant to spend. Over the next two months, however, the impact of the advance tax credit payments that went out in the middle of July as well as some much needed back-to-school shopping could offset some of these headwinds.
Industrial Production • Tuesday
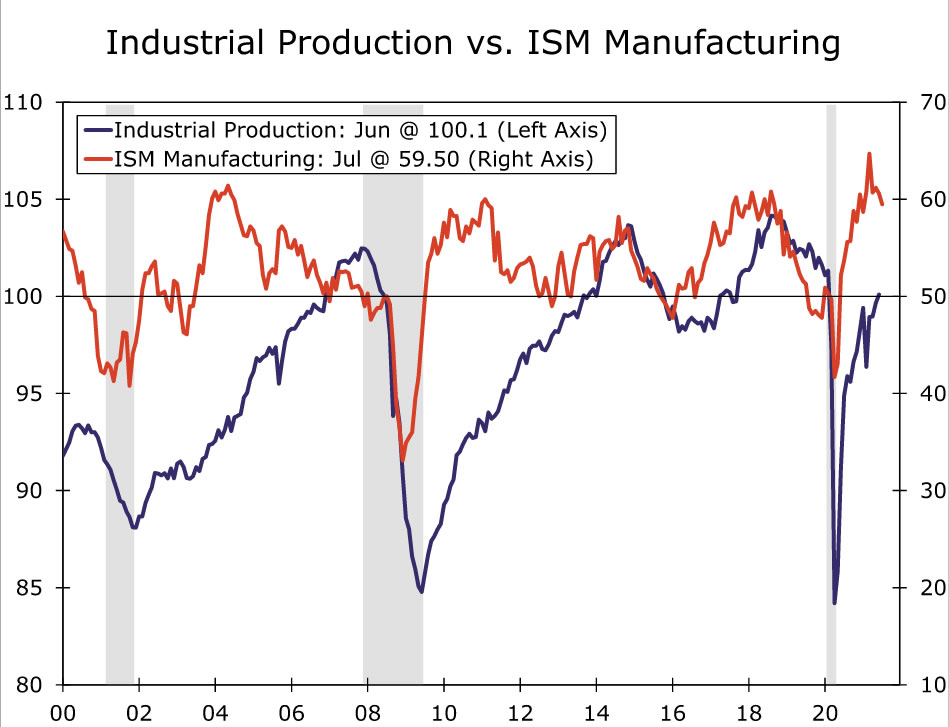
Industrial production increased 0.4% in June as gains in mining and utilities production helped offset a slight decline in manufacturing output. The slip in manufacturing output was largely driven by a 6.6% drop in motor vehicle and parts production, excluding autos manufacturing output increased 0.4%. Activity at the nation’s auto plants has been incredibly choppy in 2021, with output up one month and down the next. The back and forth is primarily a result of continued supply shortages. Demand for cars, while cooling, remains strong as evidenced by the run-up in prices over the past few months.
More broadly, fluctuations in production have been driven by supply constraints rather than any cooling in demand thus far. Looking ahead to July, the ISM manufacturing survey showed some tentative signs of supply and demand coming into balance. The supplier delivery index fell to a five-month low of 72.5, but that remains a far cry from “normal.” Slower growth in new orders appears to be helping manufacturers catch up, with the index slipping 1.1 points, although backlogs remain elevated. That said, it is likely too early to call the end of the supply problems that have bedeviled producers, and we will likely continue to see some disruptions going forward. Overall, we look for a 0.4% increase in industrial production in July, as producers continue to make due with supplies on hand and businesses try to restock depleted inventories.
Housing Starts • Wednesday
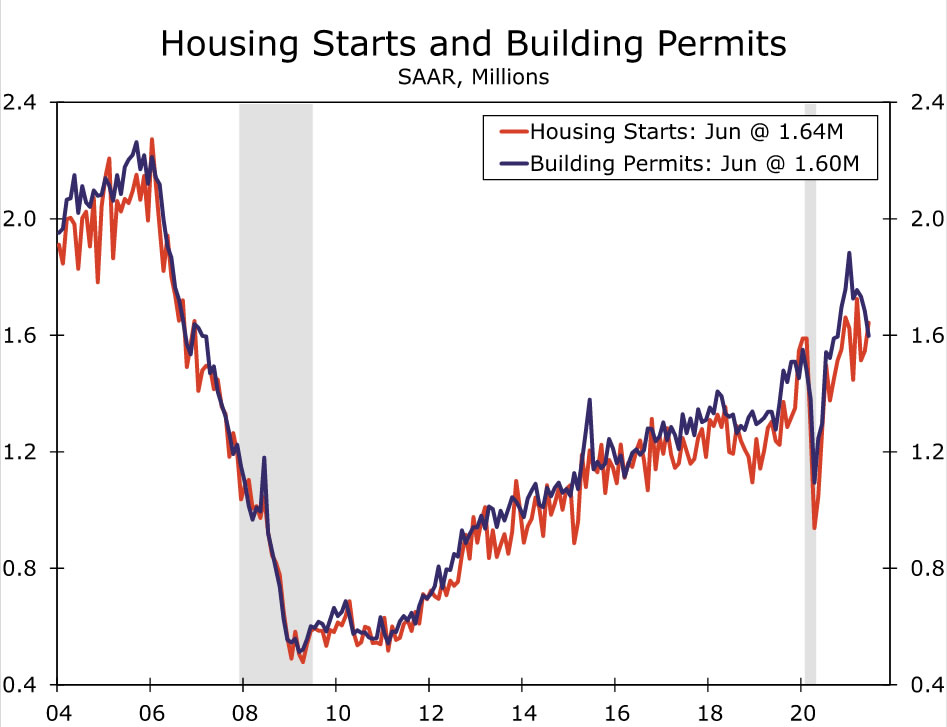
We expect housing starts cooled to a 1,602K annual rate in July, after beating expectations in June. June’s increase brought housing starts more in line with building permits, which had been running well ahead of starts over the past year. While building permits normally lead housing starts, shortages of material and labor have led to a persistent rise in the number of homes authorized but not yet started. This backlog remains elevated, but the slowdown in permits over the past few months suggests the momentum in home building has started to fade.
Much like other sectors of the economy, this appears to be more of a supply problem than a demand problem. The lack of land, materials and labor has made it difficult for builders to ramp up production to meet the surge in demand over the past year. Going forward, we still expect home building to remain strong relative to its pre-pandemic trend, especially once supply constraints start to ease.
International Review
Solid Showing From the U.K. Economy
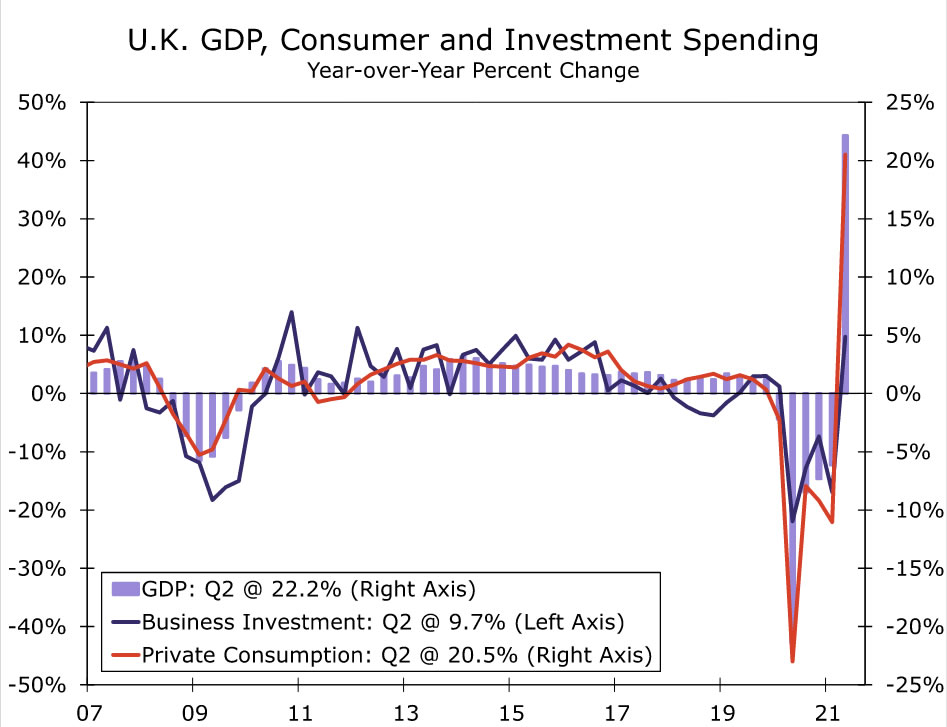
The U.K. economy put forth a sturdy performance in Q2, recovering from a COVID-related decline in activity during the first quarter of the year. Q2 GDP jumped 4.8% quarter-over-quarter, matching the consensus forecast, and by 22.2% year-over-year. In particular, private consumption and government spending were both strong, registering gains of 7.3% and 6.1% quarter-over-quarter, respectively. Q2 business investment was a slight disappointment, with a smaller gain of 2.4%.
Not only was Q2 solid as a whole, but the quarter also ended on a firm note, as June GDP rose 1.0% month-over-month, which was more than expected. Service sector activity was especially strong, with a gain of 1.5%, partly offset by a 0.7% fall in industrial output. GDP increased in June, even as the U.K. government delayed the final phase of its economic reopening from late June to late July. Looking ahead to the third quarter, while we do not expect the U.K. economy to repeat its Q2 increase, for Q3 GDP we forecast a more-than-respectable 2.5% quarter-over-quarter gain.
Inflation Concerns Persist in Latin America
Another feature of this week’s releases was the persistence of inflation pressures in Latin America. Brazil’s July CPI quickened further to 8.99% year-over-year, the fastest pace of inflation since mid-2016. Housing and transportation costs were among the components contributing to the acceleration of inflation. With the CPI running more than double this year’s CPI inflation target of 3.75%, we expect Brazil’s central bank to add to the cumulative 325 bps of Selic rate increases so far this year at upcoming monetary policy meetings.
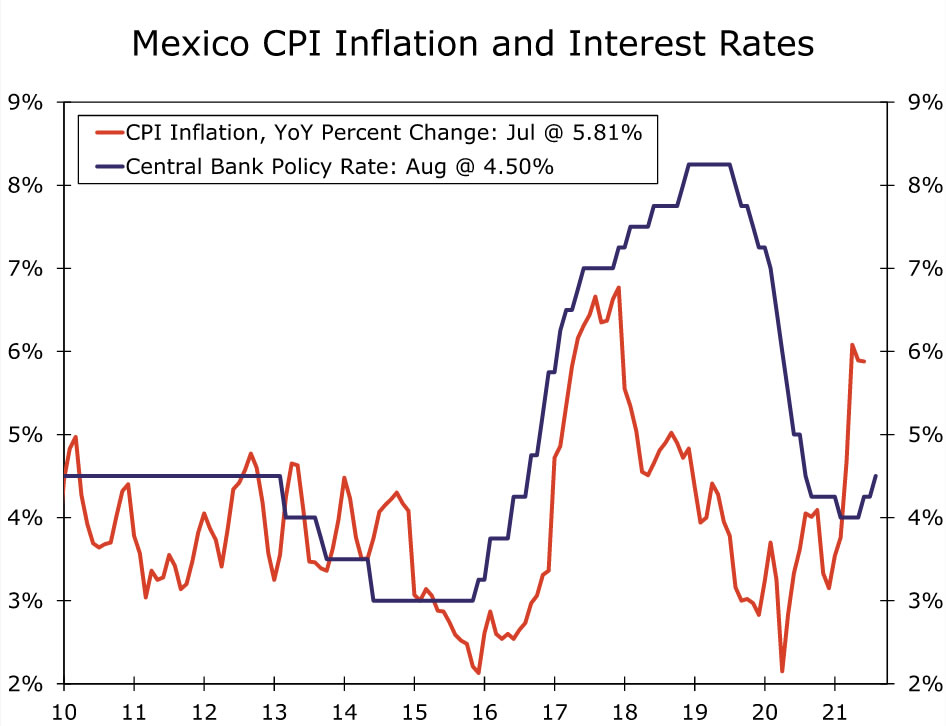
Mexico’s July CPI inflation was also elevated, albeit easing slightly to 5.81% year-over-year, while the core CPI firmed slightly to 4.66%. Elevated inflation prompted Mexico’s central bank to raise its overnight rate by 25 bps to 4.50% at this week’s monetary policy meeting. The central bank said the balance of risks around the inflation outlook was to the upside, although in somewhat less hawkish comments also said that inflation shocks should be transitory and that future monetary policy decision would be data dependent. We also observe that it was through a split vote, rather than a unanimous decision, that monetary policymakers decided to raise interest rates by a quarter point at this meeting. While we expect that policy interest rates could move higher still, it’s possible those rate hikes might not occur as quickly as expected by market participants.
International Outlook
Japan GDP • Monday
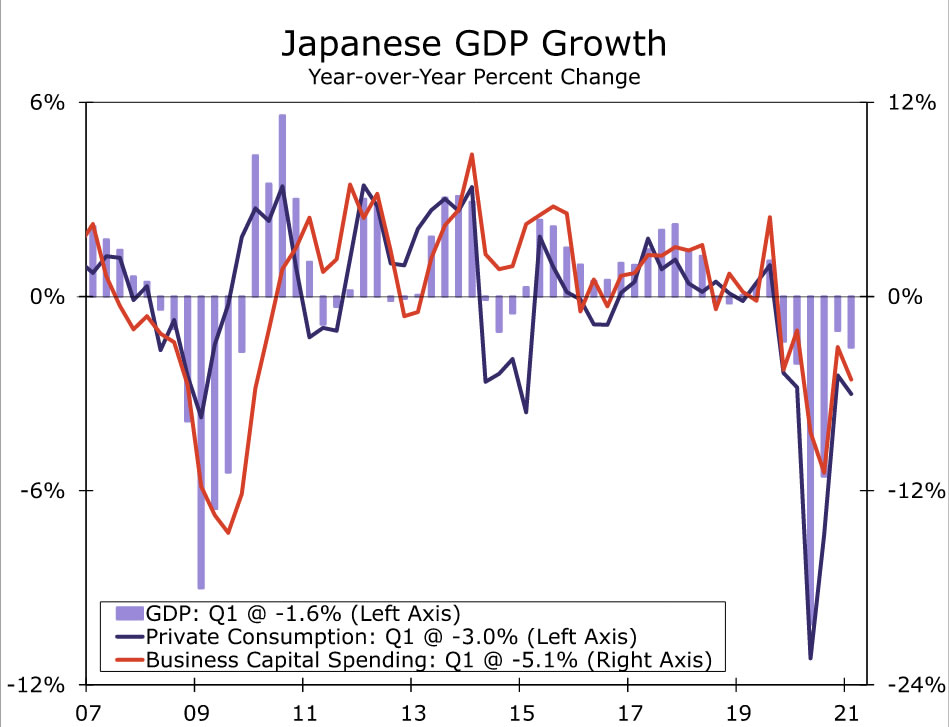
Japan’s Q2 GDP figures to be released early next week are likely to portray an economy that continued to struggle during the first half of this year. Given relatively widespread COVID cases by Japanese standards through much of 2021 and associated restrictions, consumer demand has been muted. As a result, Q1 GDP fell 3.9% quarter-over-quarter annualized, while for Q2, we expect GDP to grow at a 0.4% pace, slightly below the consensus forecast for a 0.5% gain. Within the details, consumer spending is expected to be flat in Q2, following a large decline in consumer spending during the first quarter.
The GDP data is not the only release scheduled from Japan next week. The July CPI is due, with the consensus forecast for a 0.4% year-over-year decline. The June tertiary industry index—a measure of service sector output—is expected to rise 1.8% month-over-month after a 2.7% decline in May, which should indicate that Japan’s economy finished the second quarter on a slightly better note.
China Retail Sales & Industrial Output • Monday
Over the past several weeks, China has seen some increased spread of COVID cases, prompting authorities in some regions to impose restrictions on movement and other activities. Partly due to base effects, Chinese economic growth—which had slowed in year-over-year terms in Q2—is widely expected to slow further during the third quarter.
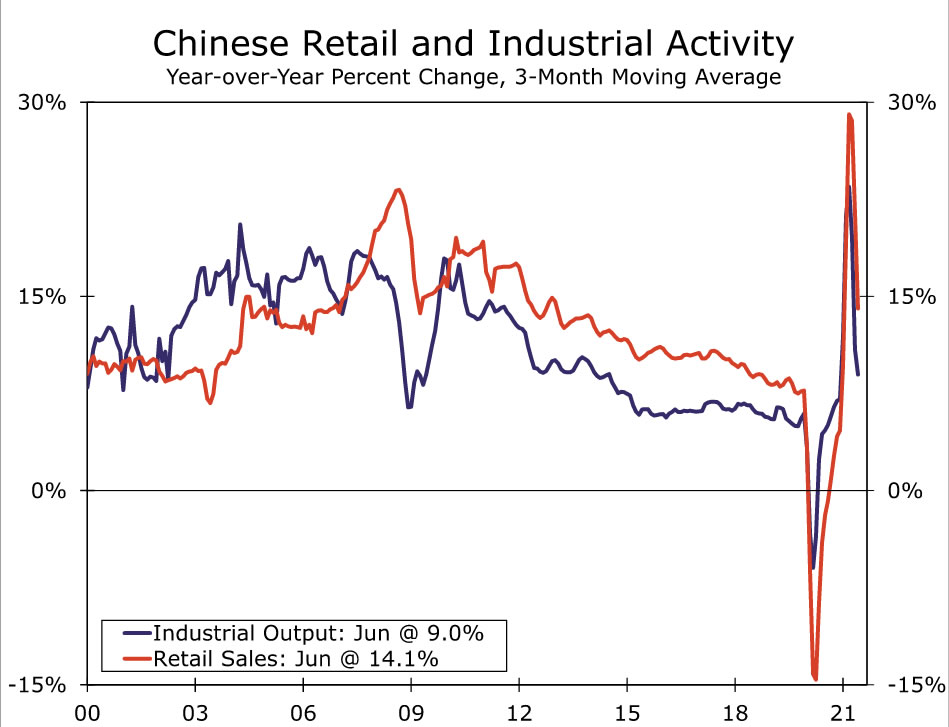
Next week’s Chinese data will offer a read on activity during early Q3. July retail sales are forecast to slow to 10.9% year-over-year, growth in July industrial output is expected to slow to 7.9%, and a slowdown in fixed asset investment growth is also anticipated. An “as expected” slowdown would likely not be especially worrying, but a precipitous slowdown might generate some concerns. For the record, we forecast a slowdown in China’s Q3 GDP growth, to 0.7% quarter-over-quarter and 5.5% year-over-year.
U.K. Retail Sales • Friday
After a solid finish to the second quarter for the U.K. economy, the consumer will be in focus next week as some data for the early part of Q3 are released. July retail sales will be closely scrutinized for any insight on whether consumer activity is beginning to regain momentum. U.K. retail sales jumped sharply during the early spring, but given a renewed surge in COVID cases in recent months (a surge that has now receded), sales were relatively tepid in May and June. For July, the consensus forecast is for another moderate month of spending from the consumer, with a 0.3% month-over-month gain in retail sales anticipated.
The July Consumer Price Index will also be closely watched, with many surveys pointing to significant price pressures and the Bank of England recently forecasting CPI inflation to reach 4% year-over-year by the end of 2021. For July, however, the consensus forecast is for a relatively contained inflation reading, with the CPI expected to slow to 2.3% year-over-year and the core CPI expected to come in at 2.2%.
Credit Market Insights
Credit Cards Along for the Spending Ride
Consumer credit outstanding grew by an astounding $37.7 billion during June, the largest increase on record, according to data released by the Federal Reserve last week. While this is a significant jump, it is important to keep in mind that these increases are coming off of a relatively low base. Through the first half of this year, household debt as a share of disposable income was near its lowest levels in decades. Due to a host of factors, including a lack of consumer spending and increased transfer payments, consumers were able to start paying down some of their debt, particularly credit card debt. We expect consumer credit will rise over the coming months, alongside the continued growth in consumer spending.
Both revolving and nonrevolving credit saw impressive gains in June, rising at an annual rate of 22% and 7.2%, respectively. For revolving credit, which is largely comprised of credit card debt, this represents the largest increase in over two decades. Even after the increases of the past few months, revolving credit still remains nearly $100 billion below where it stood pre-pandemic. When the pandemic hit, consumers adjusted not only their levels of spending, but also the methods through which they spent, relying less on credit to finance their purchases. With increased transfer payments and fewer places to spend those funds over the past 18 months, many households began to pay down their debts and deleveraged their spending. For example, a U.S. Census report cited that 15.7% of stimulus recipients used their first check to pay down debts. As stimulus checks dwindle, unemployment benefits run out and spending levels continue to increase, we should see revolving credit normalize toward its pre-pandemic trend.
Nonrevolving credit also saw healthy increases over the past few months, rising at an annual rate of 8.3% during Q2-2021. Part of this increase came from new and used car prices, which rose 20.7% on a year-over-year basis in June. Subsequently, auto loans have risen 7.1% year-over-year during Q2, as consumers have taken out larger loans to finance increasingly-expensive car purchases. As supply shortages dwindle over the remainder of the year, we expect to see some of these credit pressures recede.
Similar to many other measures of the economy, consumer credit is experiencing large increases off of low bases brought about by the pandemic. With economic conditions beginning to normalize, tracking how or if consumers shift their pandemic-induced spending methods will be important in the coming months, particularly for revolving credit.
Topic of the Week
IMF Announces Significant New Allocation of SDRs
The International Monetary Fund (IMF) recently announced a significant new allocation of special drawing rights (SDR) that is valued at $650 billion. The new allocation will boost the total value of outstanding SDRs from nearly $300 billion to about $950 billion. The allocation will go into effect on August 23, and it is the largest increase in SDRs in the 77-year history of the IMF. That said, the last allocation of $250 billion that went into effect in August 2009, in the immediate aftermath of the global financial crisis, caused the stock of outstanding SDRs to skyrocket nearly ninefold. The new SDRs will be allocated to all 190 member countries of the IMF, according to the amount of capital that each country has contributed to the IMF. For example, the United States will receive roughly $100 billion of new SDRs, which will be a significant increase to its present holdings that are valued at nearly $53 billion.
The SDR was created by the IMF in the aftermath of the Second World War as a way to supplement international liquidity. It is a so-called “basket currency” that is composed of five important national currencies. At present, one SDR is composed of roughly 0.6 U.S. dollars, 0.4 euros, 12 Japanese yen, 0.09 British pounds and 1 Chinese yuan. The SDR is a component of the international reserves that countries hold, and member countries of the IMF can exchange their holdings of SDRs with other member countries for convertible currencies.
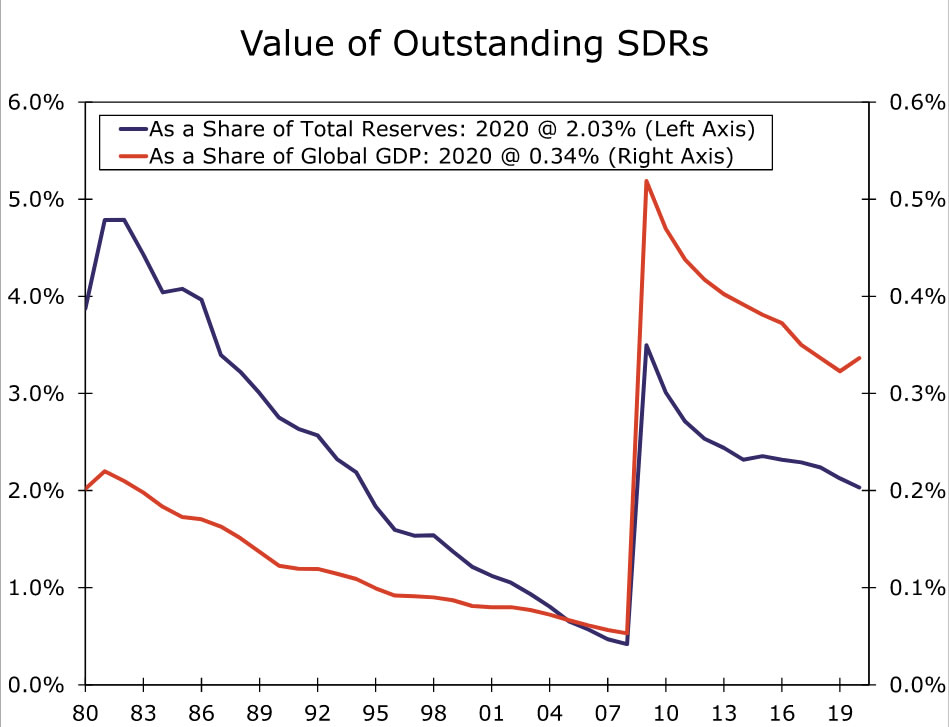
As shown in the chart, SDRs accounted for nearly 5% of all outstanding reserves in the 1980s, but that percentage has shrunk to only 2% over the past 40 years. The value of all outstanding SDRs at present is equivalent to only 0.3% or so of global GDP. The global economy has grown markedly over the past decade, yet the value of outstanding SDRs has remained essentially unchanged. Although a new allocation was more or less due, the strains that the pandemic has exerted on the global economy induced IMF policymakers to increase the outstanding stock of SDRs at this time. Once the allocation takes effect, the value of SDRs will represent about 6% of total reserves and be equivalent to approximately 1% of global GDP.
Will the new allocation have major consequence for the global economy? Probably not. The change in the stock of outstanding SDRs amounts to a scant 0.6% of global GDP. Because most countries will not “spend” their new SDRs, the allocation will have essentially no effect on global GDP growth or inflation. The SDRs will simply bolster countries’ international reserve positions, which enhance their ability to combat future financial shocks.
Source: International Monetary Fund and Wells Fargo Securities
That said, the IMF notes that wealthier countries can voluntarily “channel” some of their SDRs to poorer countries that will allow the latter to scale up their borrowing from the IMF’s Poverty Reduction and Growth Trust. Such borrowing is currently interest free. In short, the new allocation could potentially help to boost economic growth and reduce poverty, at least at the margin, in some developing economies.


